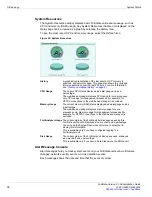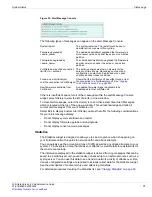
System Status
Status page
FortiGate Version 4.0 Administration Guide
01-400-89802-20090424
73
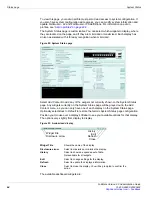
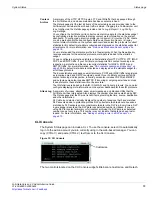
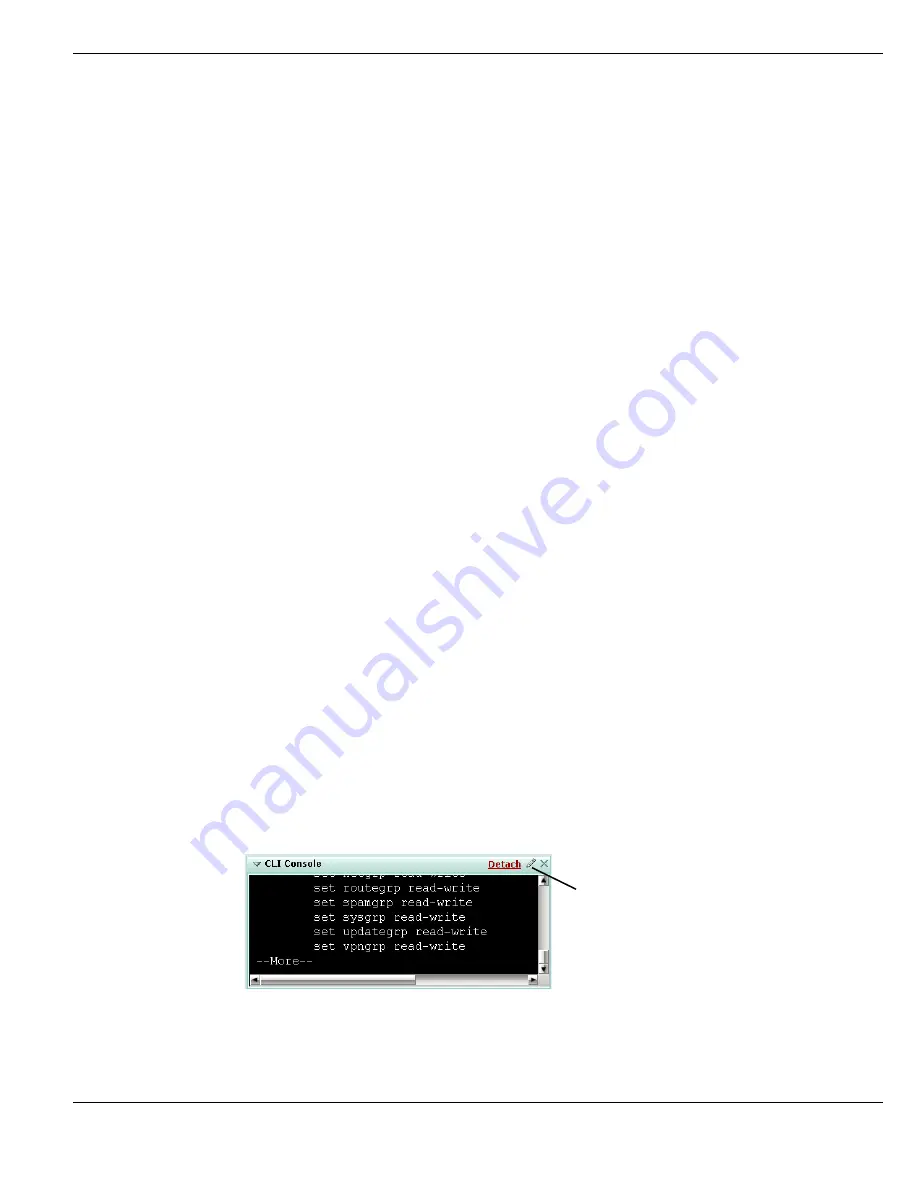
CLI Console
The System Status page can include a CLI. To use the console, select it to automatically
log in to the admin account you are currently using in the web-based manager. You can
copy (CTRL-C) and paste (CTRL-V) text from or to the CLI Console.
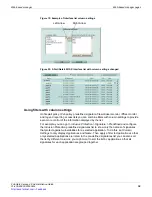
Figure 33: CLI Console
The two controls located on the CLI Console widget’s title bar are Customize, and Detach.
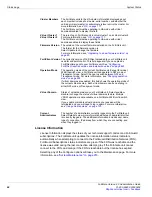
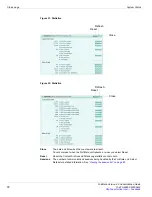
Content
Archive
A summary of the HTTP, HTTPS, email, FTP and IM traffic that has passed through
the FortiGate unit, and whose metadata has been content archived.
The
Details
pages list the last 64 items of the selected type and provides links to the
FortiAnalyzer unit where the archived traffic is stored. If logging to a FortiAnalyzer unit
is not configured, the
Details
pages provide a link to
Log & Report > Log Config >
Log Settings
.
You configure the FortiGate unit to collect content archive data for the statistics widget
by configuring protection profiles to display content meta-information on the system
dashboard. To configure a protection profile, go to
Firewall > Protection Profile
. Create
or edit a protection profile and configure
Data Leak Prevention Sensor > Display
content meta-information on the system dashboard
and select the protocols to collect
statistics for. By default meta-data is collected and displayed on the statistics widget for
all protocols. For more information, see
“Data Leak Prevention Sensor options” on
.
You must also add the protection profile to a firewall policy. When the firewall policy
receives sessions for the selected protocols, meta-data is added to the statistics
widget.
You can configure a protection profile to collect statistics for HTTP, HTTPS, FTP, IMAP,
POP3, and SMTP traffic. If your FortiGate unit supports SSL content scanning and
inspection, a protection profile can also collect statistics for IMAPS, POP3S, and
SMTPS traffic. For more information, see
“SSL content scanning and inspection” on
. By default meta-data is collected and displayed on the statistics widget for
all of these protocols.
The Email statistics are based on email protocols. POP3 and IMAP traffic is registered
as incoming email, and SMTP is outgoing email. If your FortiGate unit supports SSL
content scanning and inspection, incoming email also includes POP3S and IMAPS
and outgoing email also includes SMTPS. If incoming or outgoing email does not use
these protocols, these statistics will not be accurate.
The IM statistics are based on the AIM, ICQ, MSN, and Yahoo! protocols. You can also
configure displaying meta-information on the system dashboard for these IM protocols.
Attack Log
A summary of viruses, attacks, spam email messages, and blocked URLs that the
FortiGate unit has intercepted. Also displays the number of sessions matched by DLP.
The
Details
pages list the 20 most recent items, providing the time, source, destination
and other information.
DLP data loss detected
actually displays the number of sessions that have matched
DLP sensors added to protection profiles. DLP collects meta-data about all sessions
matched by DLP sensors and records this meta-data in the DLP log. Every time a DLP
log message is recorded, the DLP data loss detected number increases. If you are
using DLP for content summary or full content archiving the DLP data loss detected
number can get very large. This number may not indicate that data has been lost or
leaked. For more information, see
“Adding or editing a rule in a DLP sensor” on
.
Customize
Summary of Contents for Gate 60D
Page 705: ...www fortinet com...
Page 706: ...www fortinet com...

