


Page 2–24
2101510 Rev. AG
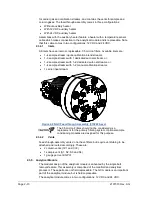
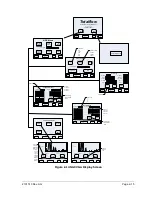
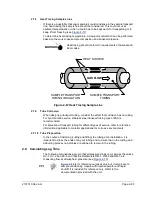
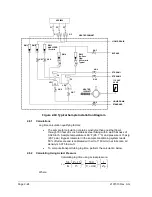
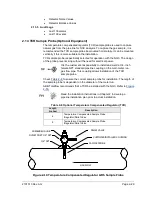
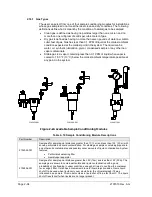
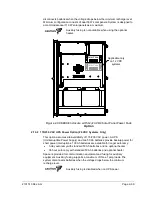
Figure 2-18 Typical Sample Installation Diagram
2.8.1
Calculations
Lag time calculation qualifying factors:
•
The sample for calculation contains mostly methane gas that flows
through 100 feet of ¼-inch stainless steel tubing with a wall thickness of
0.020-inch. Sample temperature is 80
°
F (26.7
°
C) and pressure is 15 psig
(29.7 psia). Bypass rotameter in the sample conditioning system reads
50% of full scale and is calibrated with air to 1180 cc/min at full scale. Air
density is 0.075 lbs/cu.ft.
•
To compute transport tubing lag time, perform the calculation below.
2.8.2
Calculating Using Actual Pressure
Calculating lag time using actual pressure:
×
+
×
+
=
p
s
Z
1
460
T
530
15
15
P
F
VL
t
Where:
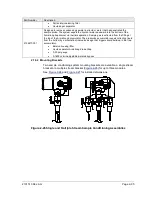
NGC8200
F1
F2
F3
G1
G2
RM-1
RM-2
RM-3
ANALYZER
10 cc/min.
RM-4
RM-5
By-Pass
Flow
800 cm/min
Typical
HV-1
HV-2
HV-3
HV-4
HV-5
HV-6
HV-7
HV-8
F4
F5
LD1
LD2
STANDARD
LIQUID DRAIN
STREAM 1
STREAM 2
BYPASS
LIQUID DRAIN
115 VAC
60 HZ
HEATER
125 WATT
HEATED CABINET