Tel: 886.2.2175 2930 Email: [email protected]
www.salukitec.com
62
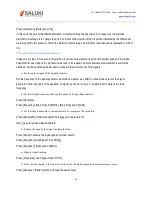
Readjust the output amplitude of the signal generator until it is shown in the screen. Reduce the sweep time (i.e.
increase the sweeping speed) until the contents similar to those in Fig. 4-24 are displayed.
c) Measure the pulse repetition interval:
Press [Sweep] and [ Sweep$Cont|Single]
Press [Peak], [Maker][Delta] and [Peak] [Next Peak]. The difference of two markers is the pulse repetition interval
(PRI), and its reciprocal is the pulse repetition frequency (PRF).
Fig. 4-24 Measurement of Pulse Repetition Frequency
4) Peak pulse power measurement
Now we have obtain the main lobe amplitude and pulse width. In addition, we can easily obtain the resolution
bandwidth of the spectrum analyzer. Therefore, the peak pulse power can be obtained based on such parameters.
In the broad-band measurement mode of the spectrum analyzer:
Peak pulse power =(main lobe amplitude) -(20 log T
eff
×BW
i
)
Where:
Teff -pulse width, in second. Second
BW
i
- impact bandwidth, in Hz (equal to the resolution bandwidth applied in 1.5
×
“Pulse width
measurement”)
Содержание S3302A
Страница 1: ...S3302 Series Handheld Spectrum Analyzer Datasheet Saluki Technology Inc...
Страница 70: ...Tel 886 2 2175 2930 Email sales salukitec com www salukitec com 70...
Страница 125: ...Tel 886 2 2175 2930 Email sales salukitec com www salukitec com 125 Fig 7 1 FM Demodulation Analysis Results...
Страница 139: ...Tel 886 2 2175 2930 Email sales salukitec com www salukitec com 139 Fig 8 3 Schematic Diagram of List Scanner...

