


Tel: 886.2.2175 2930 Email: [email protected]
www.salukitec.com
59
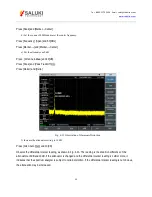
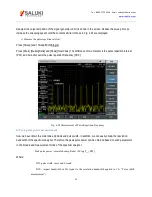
Fig. 4-21 Trace Display in Solid Line Form
c) Read the center frequency of the pulse and amplitude of the main lobe.
Press [Peak].
The marker reading is the center frequency of the pulse and amplitude of the main lobe.
d) Set the marker at the center frequency of the main lobe, and measure the side lobe ratio:
Press [Peak], [Maker], [Delta], [Peak] and [Next Peak].
The amplitude difference between the main lobe and side lobe is the side lobe ratio, as shown in Fig. 4-22.
Содержание S3302A
Страница 1: ...S3302 Series Handheld Spectrum Analyzer Datasheet Saluki Technology Inc...
Страница 70: ...Tel 886 2 2175 2930 Email sales salukitec com www salukitec com 70...
Страница 125: ...Tel 886 2 2175 2930 Email sales salukitec com www salukitec com 125 Fig 7 1 FM Demodulation Analysis Results...
Страница 139: ...Tel 886 2 2175 2930 Email sales salukitec com www salukitec com 139 Fig 8 3 Schematic Diagram of List Scanner...


