


Tel: 886.2.2175 2930 Email: [email protected]
www.salukitec.com
138
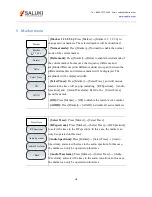
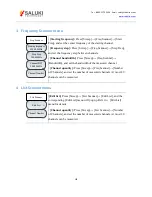
5) Press [Sweep]→ [Display Graph Table] and enable the graph display mode.
6) Press [Measure]→ [Power Display Curr Max], and enable the “Current” option. Set the current power of each
channel.
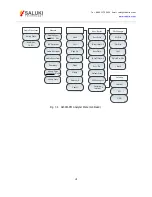
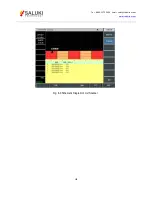
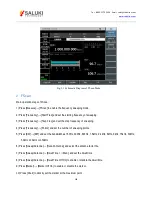
Fig. 8-2 Schematic Diagram of Frequency Scanner
3
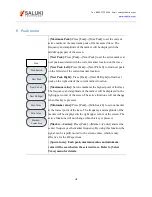
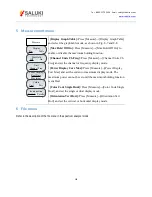
List scanner
Below is an example of the Frequency Scanner mode, mainly involving the following procedures.
1) Press [Sweep]→ [MScan] → [Edit List] and edit the channel list to be swept. The information of each channel
can be set by setting the signal standard and channel number or setting the frequency and bandwidth in the
list.
2) Press [Sweep]→ [MScan] →[Number of Channels], and set the number of measured channels. At most 20
channels can be measured at the same time.
3) Press [Sweep]→ [Display Graph Table] and enable the graph display mode.
4) Press [Sweep]→[Power Display Curr Max], and enable the “Current” option. Set the current power of each
channel.
Содержание S3302A
Страница 1: ...S3302 Series Handheld Spectrum Analyzer Datasheet Saluki Technology Inc...
Страница 70: ...Tel 886 2 2175 2930 Email sales salukitec com www salukitec com 70...
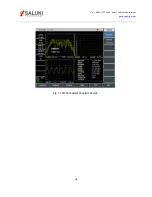
Страница 125: ...Tel 886 2 2175 2930 Email sales salukitec com www salukitec com 125 Fig 7 1 FM Demodulation Analysis Results...
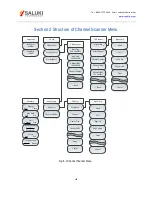
Страница 139: ...Tel 886 2 2175 2930 Email sales salukitec com www salukitec com 139 Fig 8 3 Schematic Diagram of List Scanner...


