Tel: 886.2.2175 2930 Email: [email protected]
www.salukitec.com
111
6
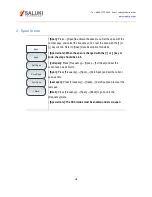
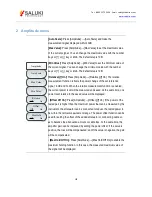
Peak menu
Peak Search
Peak
Next Peak
Next Pk Left
Next Pk Right
Max Value
Min Value
Marker ->
Center Freq
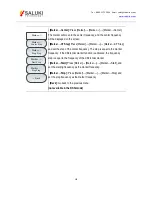
· [Max Peak]: Press [Peak]→[Max Peak] to set the current active marker
at the maximum peak of the measured trace. The frequency and amplitude
of the marker will be displayed in the middle upper part of the screen.
· [Next Peak]: Press [Peak]→[Next Peak] to set the active marker at next
peak associated with the current marker location on the trace.
· [Next Pk Left]: Press [Peak]→[Next Pk Left] to find next peak on the left
side of the current marker location.
· [Next Pk Right]: Press [Peak]→[Next Pk Right] to find next peak on the
right side of the current marker location.
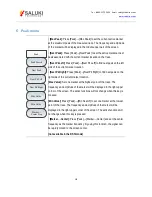
[Max Value]: Set one marker at the highest point of the trace. The
frequency and amplitude of the marker will be displayed in the right upper
corner of the screen. The active functions will not change when this key is
pressed.
[Min Value]: Press [Peak]→[Min Search] to set one marker at the lowest
point of the trace. The frequency and amplitude of the marker will be
displayed in the right upper corner of the screen. The active functions will
not change when this key is pressed.
· [Marker→Center]: Press [Peak]→[Marker→Center] and set the center
frequency as the marker frequency. By using this function, the signal can
be rapidly moved to the screen center.
(not available in the RSSI mode)
Содержание S3302A
Страница 1: ...S3302 Series Handheld Spectrum Analyzer Datasheet Saluki Technology Inc...
Страница 70: ...Tel 886 2 2175 2930 Email sales salukitec com www salukitec com 70...
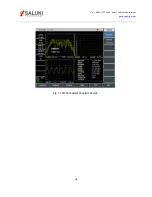
Страница 125: ...Tel 886 2 2175 2930 Email sales salukitec com www salukitec com 125 Fig 7 1 FM Demodulation Analysis Results...
Страница 139: ...Tel 886 2 2175 2930 Email sales salukitec com www salukitec com 139 Fig 8 3 Schematic Diagram of List Scanner...


