Tel: 886.2.2175 2930 Email: [email protected]
www.salukitec.com
99
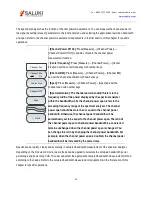
If the sweep interval is more than 0, the trace will be in the maximum holding state, so as to ensure that the maximum value of the signal in each sweeping
will be displayed on the screen.
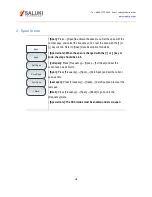
e) Press [Sweep Time] and set the record time. Then press [Auto Save Off On] to enable the auto saving mode. In
this case, the data will be saved automatically after sweeping of one screen.
f) Press [Auto Save]→[Time Cursor] and move the horizontal line with the number keys, [↑], [↓] or knob in the
vertical direction of the spectrogram. The following spectrogram will display the trace information on the line.
If the time marker value is more than 0., the trace and spectrogram will not be refreshed.
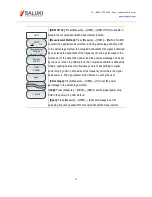
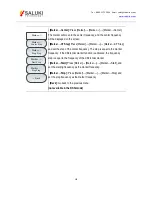
g) The interference analyzer mode of S3302 series spectrum analyzer involves six independent markers, which are
used for reading the amplitude and frequency corresponding of the marker. Specific operations are as follows:
[Maker]→[Marker 1 2 3 4 5 6].
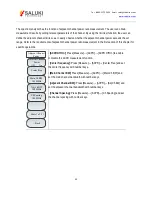
h) Press [Save/Recall]→[Save Pic] to save the current spectrogram information in the picture form.
The spectrogram test structure is in Fig. 5-1 (the displayed contents vary from parameter settings, and Fig. 5-1 only
shows an example).
Содержание S3302A
Страница 1: ...S3302 Series Handheld Spectrum Analyzer Datasheet Saluki Technology Inc...
Страница 70: ...Tel 886 2 2175 2930 Email sales salukitec com www salukitec com 70...
Страница 125: ...Tel 886 2 2175 2930 Email sales salukitec com www salukitec com 125 Fig 7 1 FM Demodulation Analysis Results...
Страница 139: ...Tel 886 2 2175 2930 Email sales salukitec com www salukitec com 139 Fig 8 3 Schematic Diagram of List Scanner...


