Tel: 886.2.2175 2930 Email: [email protected]
www.salukitec.com
43
5
Drift signal measurement
1) Definition of drift signal
If the drift signal is measured with the spectrum analyzer, the center frequency should be changed in different
period so as to facilitate observation. If the signal tracking function of the spectrum analyzer is enabled, the marker
peak will always be displayed at the center frequency of the spectrum analyzer, thus facilitating measurement.
This section introduces how to measure the drift signal, in which the signal tracking function, marker function and
maximum holding function of the spectrum analyzer are applied to observe the amplitude trace and occupied
bandwidth of the drift signal.
5.1.1.1
2) Measurement of frequency drift for signal generator
The spectrum analyzer is able to measure the short-time and long-time stability of the signal generator. By using
the maximum trace holding function, the spectrum analyzer can display the maximum peak amplitude and
frequency drift of the input signal. The max hold function of track may be used to measure the occupied bandwidth
of signal.
In this example, the signal tracking function of the spectrum analyzer is applied to keep the drift signal always
displayed at the center and the maximum trace holding function to capture the drift.
a) Set the output signal of the signal generator:
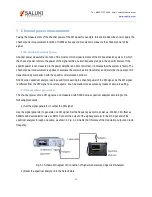
Set the signal generator to output the 300MHz and -20dBm signal. Connect the output of the signal generator to the
input port of the spectrum analyzer, as shown in Fig. 4-1. Enable the RF output.
b) Set the center frequency, span and reference level of the spectrum analyzer:
Press [Reset].
Press [Frequency], [Center Frequency], 300[MHz].
Press [frequency], [Span] and 10[MHz].
Press [Amplitude] , [Ref Level] and -10[dBm].
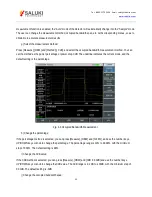
c) Set the marker at the signal peak, and enable the signal tracking function.
Press [Peak] and [Peak Track Off On].
Press [Frequency] and [Signal Track Off On].
d) Reduce the span:
Press [Frequency], [Span] and 500 [kHz]. You can see that the signal is always at the center.
Содержание S3302A
Страница 1: ...S3302 Series Handheld Spectrum Analyzer Datasheet Saluki Technology Inc...
Страница 70: ...Tel 886 2 2175 2930 Email sales salukitec com www salukitec com 70...
Страница 125: ...Tel 886 2 2175 2930 Email sales salukitec com www salukitec com 125 Fig 7 1 FM Demodulation Analysis Results...
Страница 139: ...Tel 886 2 2175 2930 Email sales salukitec com www salukitec com 139 Fig 8 3 Schematic Diagram of List Scanner...


