Tel: 886.2.2175 2930 Email: [email protected]
www.salukitec.com
46
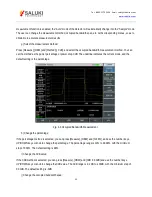
S/N=85dBc/Hz - 10×log(30kHz) =40.2dBc/(30kHz)
If the differential marker is less than one fourth of the edge distance between the signal peak and response, errors
may occur in noise measurement.
Fig. 4-10 S/N Measurement
3) Noise measurement by noise marker function
In this example, the noise of 1Hz bandwidth is measured by the noise marker function, using the 1GHz external
signal.
a) Set the output signal of the signal generator:
Set the frequency of the signal generator as 1GHz and power as -10dBm. Connect the output of the signal
generator to the input port of the spectrum analyzer, and enable the ON state of the radio frequency.
b) Set the center frequency, span, reference level and attenuator.
Press [Reset].
Press [Frequency], [Center Frequency], 999.98[MHz]
Press [frequency], [Span] and 100[kHz].
Press [Amplitude], [Ref Level] and -10[dBm].
Press [Amplitude], [Atten Auto Man] and 40[dB].
Содержание S3302A
Страница 1: ...S3302 Series Handheld Spectrum Analyzer Datasheet Saluki Technology Inc...
Страница 70: ...Tel 886 2 2175 2930 Email sales salukitec com www salukitec com 70...
Страница 125: ...Tel 886 2 2175 2930 Email sales salukitec com www salukitec com 125 Fig 7 1 FM Demodulation Analysis Results...
Страница 139: ...Tel 886 2 2175 2930 Email sales salukitec com www salukitec com 139 Fig 8 3 Schematic Diagram of List Scanner...


