Tel: 886.2.2175 2930 Email: [email protected]
www.salukitec.com
58
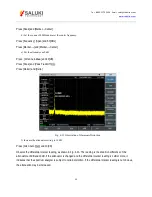
Press [BW], [Detector] and [Peak] to activate the peak detector.
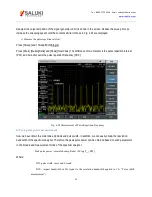
Enable the center frequency function and adjust the span until the center side lobe and at least one pair of side
lobes appear on the screen, as shown in Fig. 4-20.
Fig. 4-20 Main Lobe and Side Lobe
Increase the sweep time (decrease the sweeping speed) until the graph is filled into a solid line, as shown in Fig.
4-21. If the spectrum line cannot be filled, it indicates that the instrument is not in the broad band mode. In this case,
the following steps of measurement of the sidelobe ratio, pulse width and peak pulse power will not apply. The
resolution bandwidth should be more than 1kHz.
Содержание S3302A
Страница 1: ...S3302 Series Handheld Spectrum Analyzer Datasheet Saluki Technology Inc...
Страница 70: ...Tel 886 2 2175 2930 Email sales salukitec com www salukitec com 70...
Страница 125: ...Tel 886 2 2175 2930 Email sales salukitec com www salukitec com 125 Fig 7 1 FM Demodulation Analysis Results...
Страница 139: ...Tel 886 2 2175 2930 Email sales salukitec com www salukitec com 139 Fig 8 3 Schematic Diagram of List Scanner...


