Tel: 886.2.2175 2930 Email: [email protected]
www.salukitec.com
41
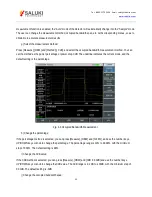
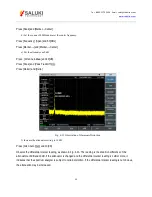
Fig. 4-7 Signal Peak at Reference Level
f) Set the second marker and measure the distortion product:
Once the marker is activated, the second marker will be generated by the differential marker function, and the
difference between both markers will be displayed. In this case, relative measurement can be performed easily.
Press [Peak] to activate one marker.
Press [Maker] and [Delta] to activate the second marker.
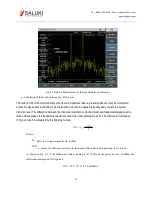
Press [Peak] and [Next Pk Left] or [Next Pk Right] to set the second marker at the peak point of the distortion
product beside the signal generated by the signal generator. As shown in Fig. 4-8, the frequency and amplitude
difference of both markers will be shown in the marker display zone, and the marker amplitude difference will be the
measured value of third-order IM distortion.
Содержание S3302A
Страница 1: ...S3302 Series Handheld Spectrum Analyzer Datasheet Saluki Technology Inc...
Страница 70: ...Tel 886 2 2175 2930 Email sales salukitec com www salukitec com 70...
Страница 125: ...Tel 886 2 2175 2930 Email sales salukitec com www salukitec com 125 Fig 7 1 FM Demodulation Analysis Results...
Страница 139: ...Tel 886 2 2175 2930 Email sales salukitec com www salukitec com 139 Fig 8 3 Schematic Diagram of List Scanner...


