Generating Graph Overlays
DVVA II 4000
3-28
400-42803-01 (Rev B) - July 2017
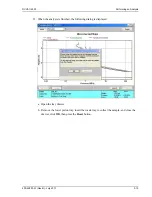
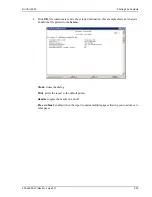
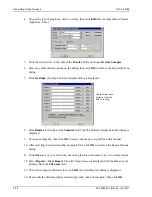
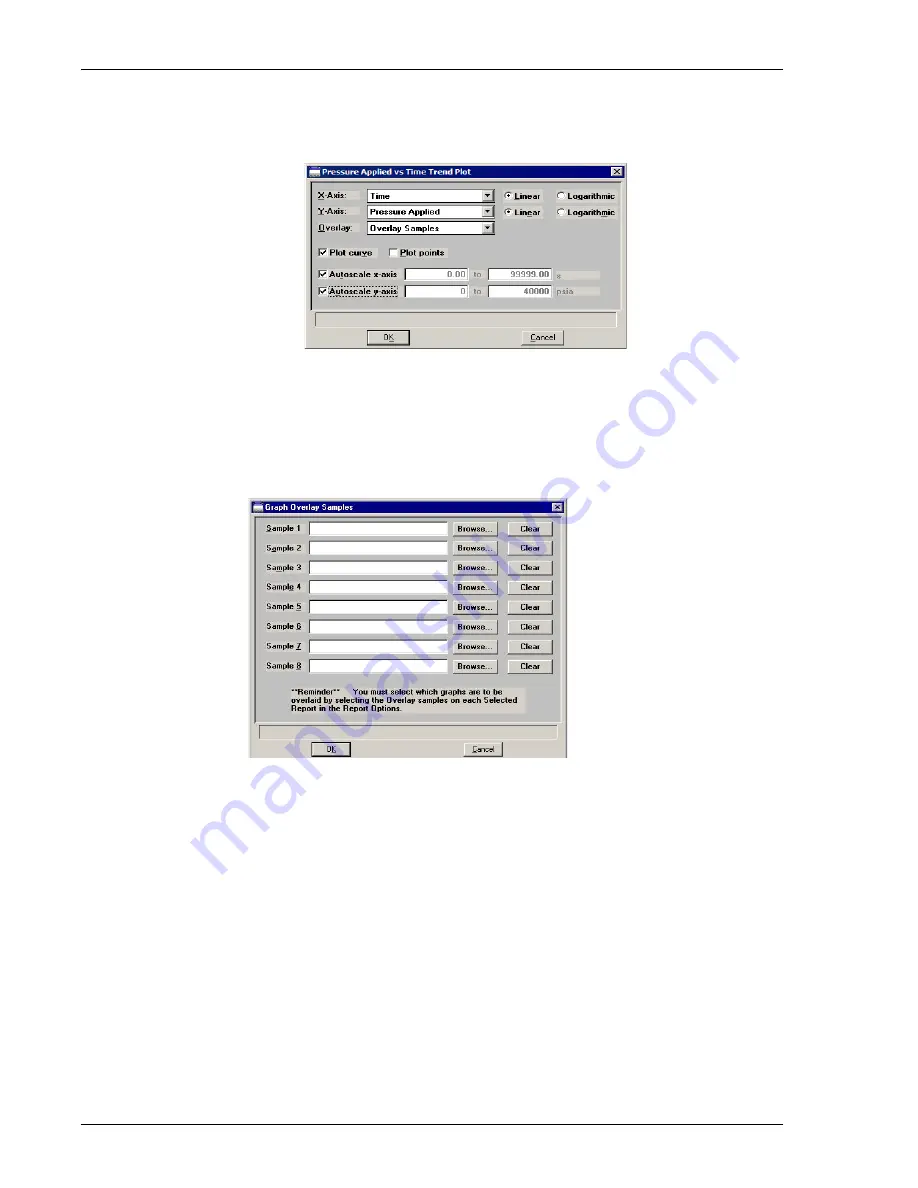
4. Choose the type of graph you wish to overlay, then click
Edit
(this example shows Pressure
Applied vs. Time).
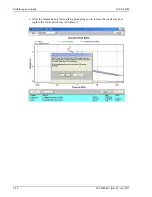
5. Click the down arrow to the right of the
Overlay
field and choose
Overlay Samples
.
6. Select any other desired options on the dialog, then click
OK
to return to the Report Options
dialog.
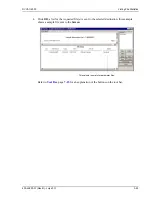
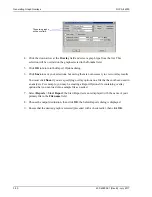
7. Click
Overlays
; the Graph Overlay Samples dialog is displayed.
8. Click
Browse
to the right of the
Sample 1
field; the Plot Overlay Sample Selection dialog is
displayed.
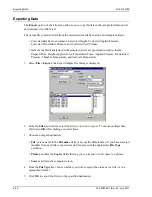
9. Choose a sample file, then click
OK
. You may choose up to eight files in this manner.
10. After selecting the desired number of sample files, click
OK
to return to the Report Options
dialog.
11. Click
Save
to save your selections, but saving them is not necessary to view overlay results.
12. Select
Reports > Start Report
. The Start Report screen is displayed with the name of your
primary file in the
File name
field.
13. Choose the output destination, then click
OK
; the Select Reports dialog is displayed.
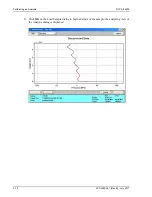
14. Ensure that the desired graph is selected (preceded with a check mark), then click
OK
.
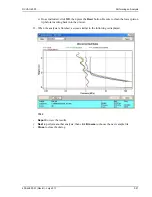
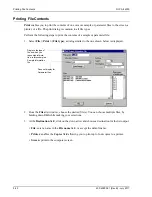
Use the Clear push
button to clear the
field of its entry.
Содержание DVVA II 4000
Страница 1: ...DVVA II 4000 Dynamic Void Volume Analyzer Operator s Manual Rev B 400 42803 01 July 2017 ...
Страница 4: ......
Страница 10: ...Table of Contents DV VA II 4000 vi 400 42803 01 Rev B July 2017 ...
Страница 16: ......
Страница 32: ......
Страница 116: ......
Страница 136: ......
Страница 160: ......
Страница 180: ......
Страница 212: ......
Страница 214: ......
Страница 240: ......
Страница 246: ......
Страница 248: ......

