diamond - User Manual
Version: 8.0.0/1
Exported on: 24 October, 2023
132
/
228
•
•
◦
◦
•
•
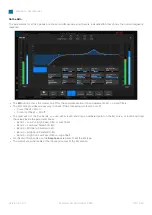
On the GUI...
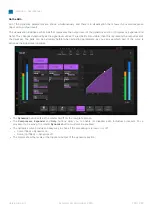
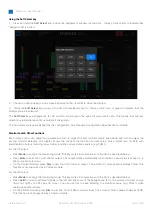
All of the parameters are shown on a single page, and there is a visualization that shows the overall response (input versus
output level).
The visualization includes a white
ball that
represents the output level of the limiter. This changes dynamically as the signal
level varies. The ball can be extremely helpful when adjusting parameters, as you can see which part of the curve is active
as the signal level changes.
Enable the
Limiter
button to
turn on the processing.
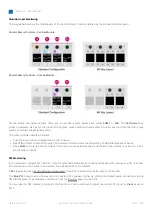
The limiter curve provides an easy way to check if the processing is turned on or off:
Curve (filled) = Limiter on.
Curve (not filled) =
Limiter off.
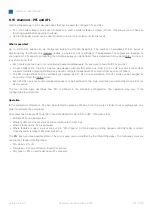
Touch and drag and parameter values to adjust the behavior.
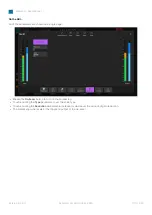
The meters show the levels at the input and output of the limiter section.

