GE M
EDICAL
S
YSTEMS
D
IRECTION
2392751-100, R
EVISION
3
V
IVID
™ 4 S
ERVICE
M
ANUAL
7-10
Section 7-3 - Performing Front End (FE) Diagnostics
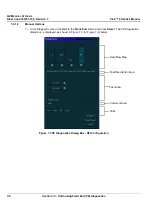
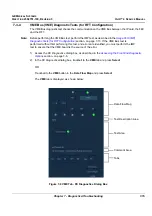
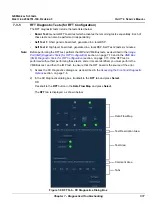
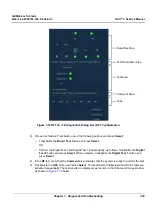
The
FE Diagnostics
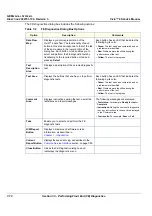
dialog box includes the following options:
Table 7-2
FE Diagnostics Dialog Box Options
Option
Description
Comments
Data Flow
Map
Displays a graphic representation of the
Vivid™ 4 data flow. The functionality of each
button in this area corresponds to that of the tab
of the same name in the lower portion of the
dialog box. Each button or tab enables you to
select and perform the FE diagnostic tests by
trackballing to the required button or tab and
pressing
Select
.
Each button has an LED that indicates the
following by its color:
•
Green:
The test has been completed and no
problems were identified.
•
Red:
Problems were identified during the
performance of the test.
•
Yellow:
The test is in progress.
Test
Description
Area
Displays a description of the selected diagnostic
test.
Test Area
Displays the buttons that enable you to perform
diagnostic tests.
Each button has an LED that indicates the
following by its color:
•
Green:
The test has been completed and no
problems were identified.
•
Red:
Problems were identified during the
performance of the test.
•
Yellow:
The test is in progress.
Comment
Area
Displays instructions during the test, as well as
test status and result messages.
The following messages are displayed:
•
Test status:
For example,
Ready for test
or
Complete
•
Instructions:
During the course of a diagnostic
test, any instructions to the user are displayed
in the Comment area
•
Test results:
For example,
Pass
or
Fail
.
Tabs
Enable you to select and perform the FE
diagnostic tests.
H/W Report
Button
Displays hardware and software version
information, as described in
Current
Report Button
Displays the saved error log, as described in the
Close Button
Closes the
FE Diagnostic
dialog box and
redisplays the
Diagnostic
menu.

