17-3
IM AQ1200-01EN
Event Mapper
3
2
1
4
5
6
7
8
9
10
11
12
13
14
15
16
17
18
19
App
Index
20
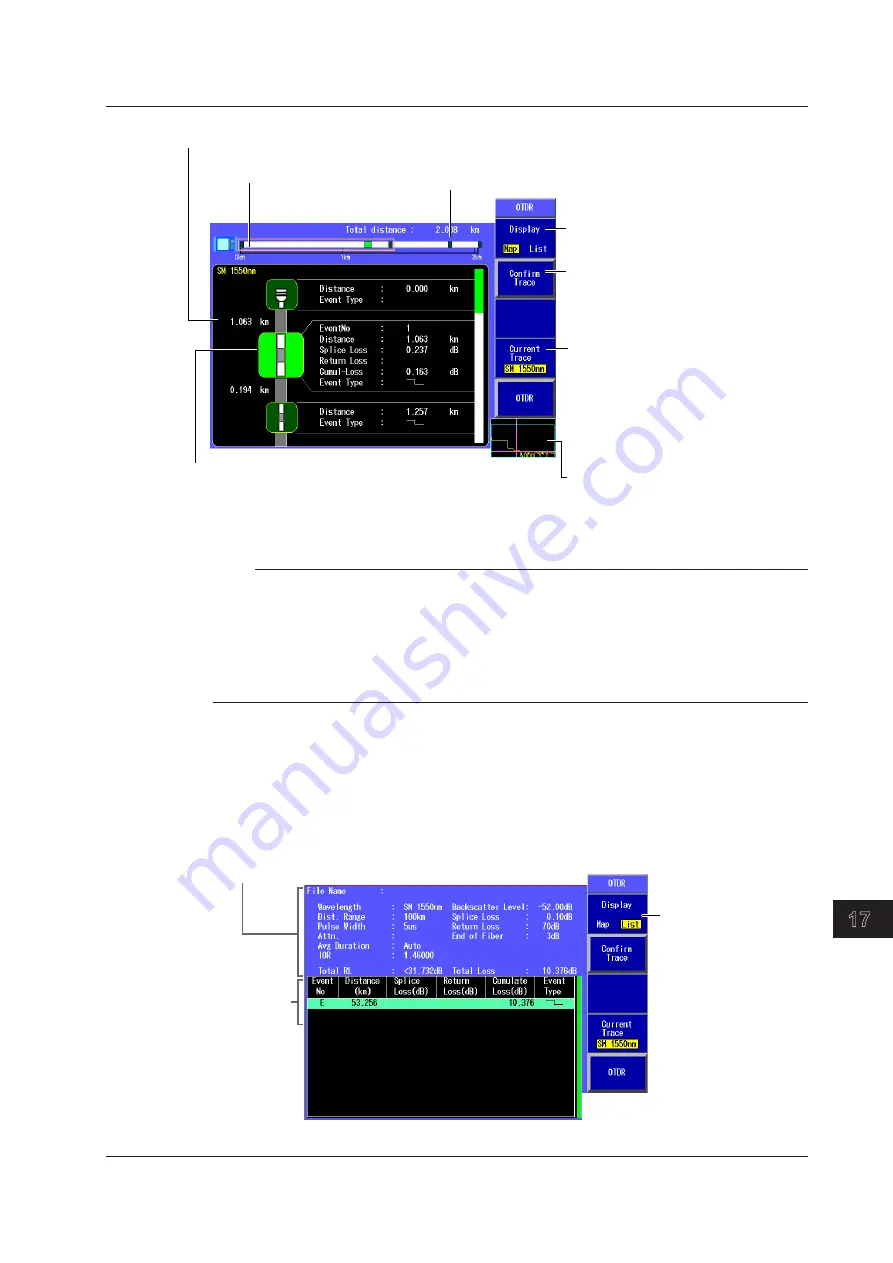
Icon of the selected event
The background color is displayed more
brightly than that of other icons, and detailed
event information is displayed.
Distance from the start point to the end point
Distance between events
The event positions displayed on the
screen is enclosed in a frame.
Set the displayed items to “Map.”
Confirm the waveform.
You can confirm the waveform of the
selected event.
Set the wavelength.
The events for the selected wavelength
are displayed.
The available options vary depending
on the model.
For details, see the explanation in
section 3.5.
Overview display
The position of the selected event is
indicated with a marker.
Note
• To stop the averaged measurement in progress, press AVE.
The averaged measurement will stop, and the screen that was showing before the measurement will
reappear.
• During averaged measurement, you cannot set the measurement conditions.
• You can start averaged measurement by pressing AVG even while the measurement setting screen is
showing.
• You cannot use event mapper during real-time measurement.
5.
Press the Display soft key to select List.
The following screen appears.
6.
Turn the rotary knob to move the cursor to the event that you want to display the measurement
conditions for.
Measurement conditions
For details on the measurement conditions,
see section 3.5.
List display
Set the displayed
items to “List.”
17.1 Displaying Optical Fiber Events as Icons


