9-5
IM AQ1200-01EN
Optical Power Meter (Option)
3
2
1
4
5
6
7
8
9
10
11
12
13
14
15
16
17
18
19
App
Index
20
9.3 Logging Measured Values and Saving Logged
Results
Procedure
Logging Screen
Screen display items: Power Meter
1.
Using the
rotary knob
and
ENTER
, select
LS_OPM
(the power meter light source).
2.
Press the
Logging
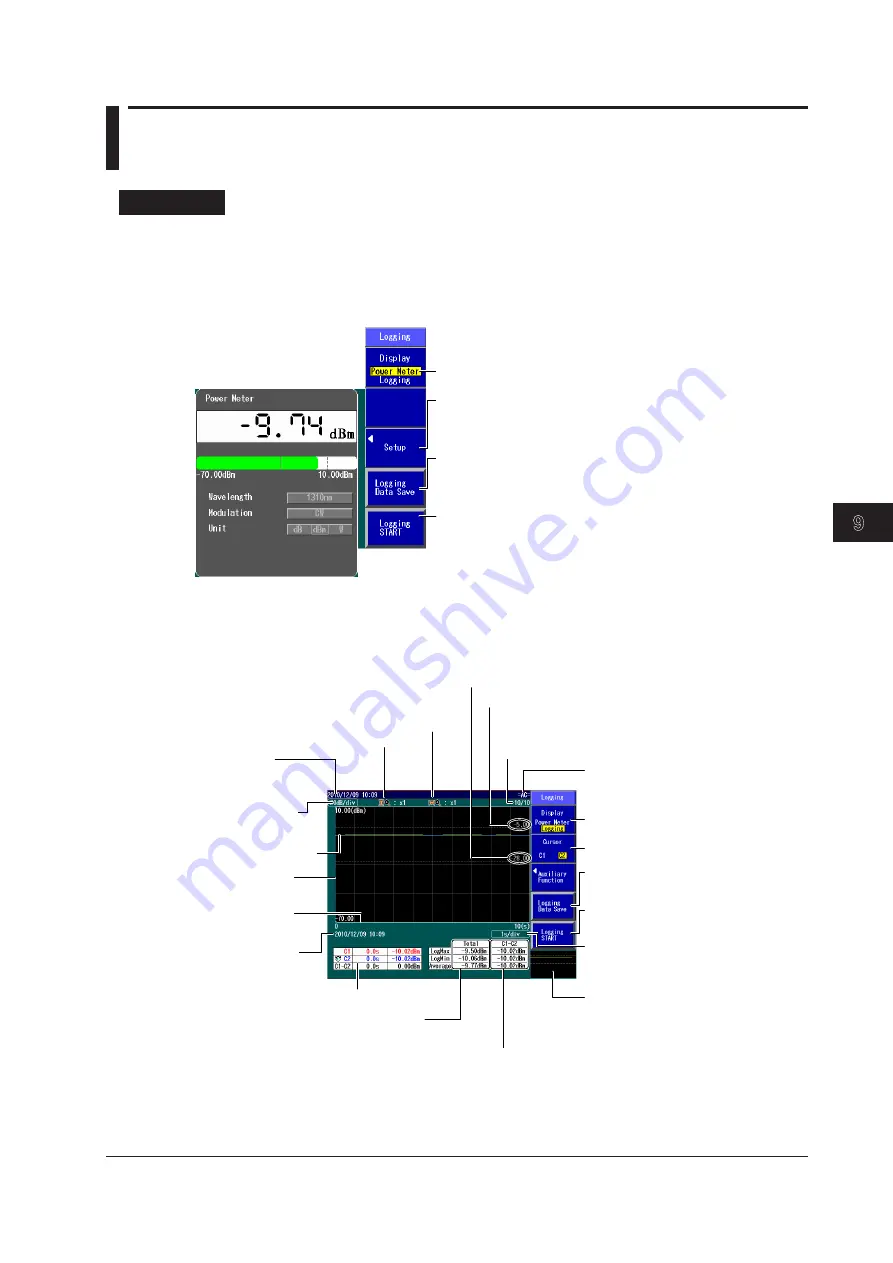
soft key to select Power Meter. The following screen appears.
Set Display to “Power Meter.”
Displays the detailed setup screen
This performs the same operation as when you press SETUP.
See the Detailed Setup screen on page 9-7.
Saves log data
A screen for setting the file save destination and the file name
appears. See the File Save screen described below.
Starts logging
Set the measurement interval and the logging count in the
Detailed Setup screen on page 9-7.
After the specified number of logs are recorded, a screen for
saving the logged results appears (see the File Save screen
described below).
Screen display items: Logging
3.
Press the
Display
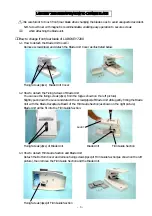
soft key to select Logging. The following screen appears.
Date and time
See the operation guide,
IM AQ1200-02EN.
Cursor
Value per division
on the vertical axis
Optical power
(vertical axis)
Logging time
(horizontal axis)
Date and time that
logging was executed
Vertical zoom factor
Horizontal zoom factor
Optical power at the cursor position
Remaining battery power or AC
See the operation guide,
IM AQ1200-02EN.
Set Display to “Logging.”
Select the cursor (C1, C2).
See the description of the “Logging
Data Save” soft key above.
See the description of the “Logging
START” soft key above.
Entire graph
The section that is displayed in the
display area is indicated by a box
(overview).
Distance per division on the
horizontal axis
Measurement count
The number of times that logging has currently been
executed and the total number of times to execute logging
Maximum, minimum, and average of the logging data
within the area specified by the cursor
Maximum, minimum, and average
of all the logging data
Upper threshold
Lower threshold


