


NOTE:
COMTRADE files can only be downloaded using an Ethernet
connection. They cannot be downloaded using serial, modem or Ethernet
gateway connections.
See the
COMTRADE and ION technology
technical note, available from
www.usa.siemens.com/pds, for detailed information about COMTRADE file
formats and implementation.
Related Topics
Configuring Sag/Swell logging using ION Setup
Viewing waveforms on your meter’s webpages
Waveforms on your meter’s webpages
You can use the waveform viewer on the meter’s webpages to view waveforms
generated as a result of power quality events.
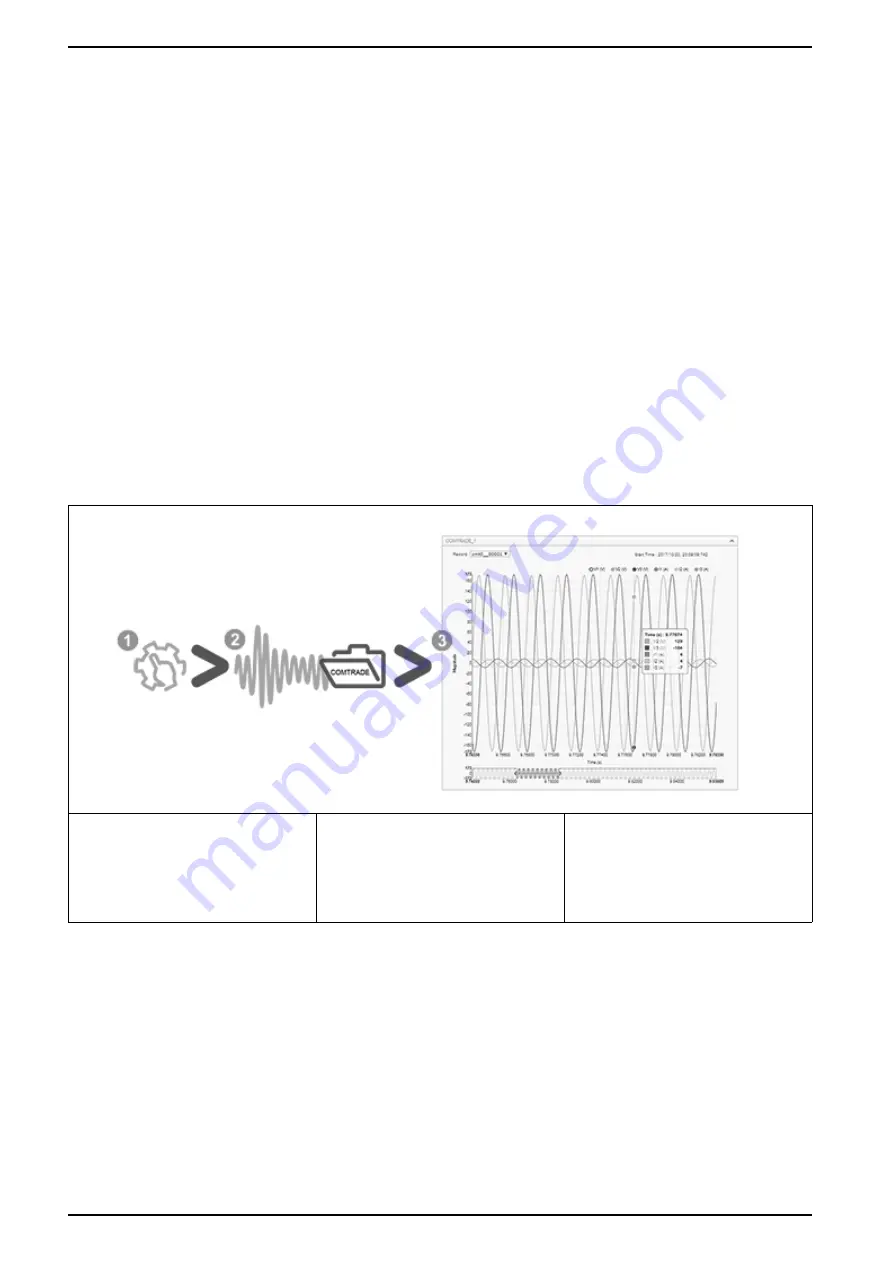
Overview of how to setup and view waveforms on your meter’s webpages
Before you can view waveforms on the meter’s webpages, you need to perform
some basic configuration to enable waveform capture and store the waveforms in
COMTRADE format.
1. Enable waveform capture on
your meter
Set the meter’s nominal voltage using ION
Setup or the webpages.
2. A waveform is captured when
a power quality event occurs
A COMTRADE record is generated and
saved to your meter’s ftp site.
3. View the waveform on the
meter’s webpages
Go to the waveform viewer (Monitoring >
Waveforms) to explore the waveform data.
The waveform viewer uses the meter’s COMTRADE files to display the
waveforms. If the events you want to capture are not included in the default
framework, you can customize the meter’s waveform recording framework.
Overview of the webpage waveform viewer
After COMTRADE files are generated by your meter, you can view them using the
waveform viewer.
150
7EN05-0390-00
Summary of Contents for 9810 Series
Page 1: ...9810 series User manual 7EN05 0390 00 09 2018 www usa siemens com pds ...
Page 4: ......
Page 12: ......