MONITORING
7
81
8021804/2017-11-27|SICK
Subject to change without notice
T R A N S L A T I O N O F T H E O R I G I N A L I N S T R U C T I O N S | Telematic Data Collector
7.2.5
Analyzing sensor data in detail
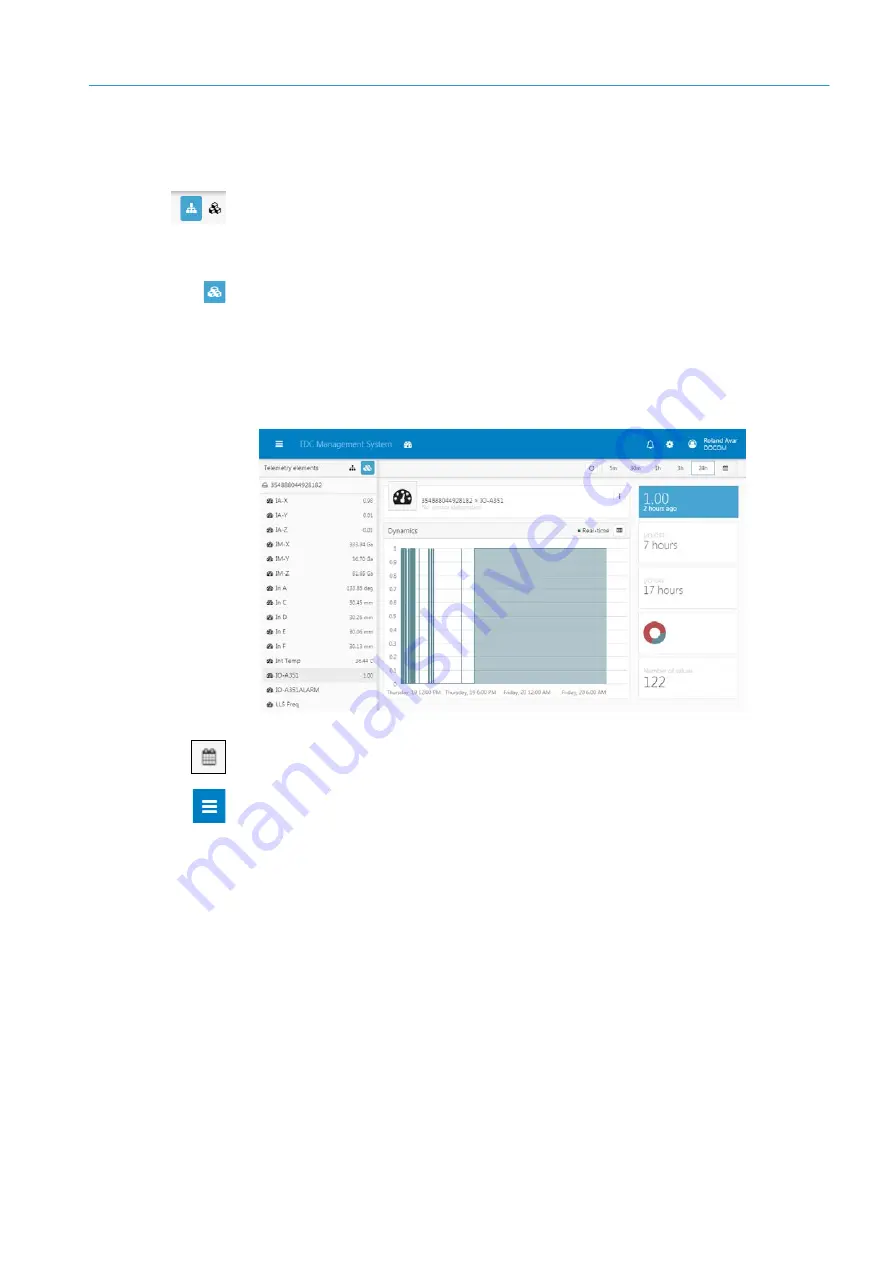
From the list of telemetry elements on the left-hand side of the dashboard, detailed
information on the connected sensors can be displayed and analyzed.
A telemetry element can be selected from the structure defined for your dashboard or
from a list containing all telemetry elements configured for the TDC devices. You can
use the two icons above the list to switch between these two views.
1. Click on the
Show devices view
icon. All of the telemetry elements for the registered
TDC devices will be displayed.
2. Mark a telemetry element in the list. In this example, a digital sensor is selected.
The signal statuses provided by the sensor can be analyzed for different periods. In
addition to this, a customized time window can be defined.
The calendar icon can be used to compare two different periods.
▸
Collapse the list of telemetry elements using the menu icon to get more space on the
screen for data analysis.


