

87
GRAPHING FUNCTIONS
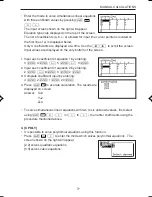
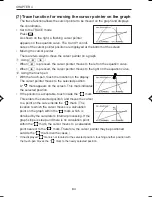
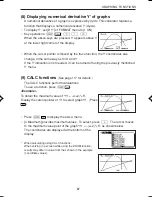
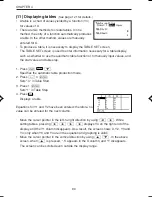
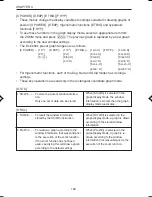
(8) Displaying numerical derivative Y’ of graphs
A numerical derivative of a graph is expressed by dy/dx. This calculator features a
function that displays a numerical derivative Y’ (dy/dx).
• To display Y’, set [D Y’] of FORMAT menu to [1 ON].
• Key operations:
Ï
D 1 ¬
When the above keys are pressed, Y’ appears above Y
at the lower right corner of the display.
• When the cursor pointer is moved by the trace function, the Y’ coordinates also
change, in the same way as for X and Y.
If the Y’ indication is not needed, it can be turned off using the previously mentioned
Y’ menu.
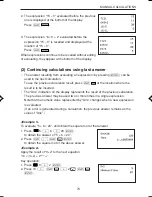
(9) CALC functions
(See page 117 for details.)
The CALC functions perform calculations.
To use a function, press
Ï
.
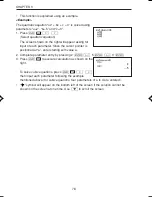
<Example>
To obtain the maximum value of “Y1 = –(x+2)
2
+5”.
Display the cursor pointer at Y1 to select graph Y1. (Press
.)
• Press
Ï
to display the CALC menu.
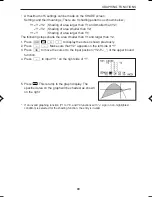
• [4 Maximum] provides maximum values. To select, press
4
. The cursor moves
to the maximum value point of the graph “Y1 = –(x+2)
2
+5”, as shown below.
The coordinates are displayed at the bottom of the
display.
*
When calculating using CALC functions:
When solving in a screen while using the ZOOM function,
results may differ in value from that shown in the example
(coordinate values).
EL-9650-(04)En (079-134)
8/7/00, 9:07 PM
87
Summary of Contents for EL-9650
Page 10: ...viii ...
Page 46: ...36 CHAPTER 1 ...
Page 230: ...220 CHAPTER 9 ...
Page 268: ...258 CHAPTER 12 ...
Page 349: ...339 APPENDIX When coordinate system is Rect param or polar ...
Page 350: ...340 APPENDIX When coordinate system is Seq F STYLE2 E STYLE1 ...
Page 352: ...342 APPENDIX ...
Page 353: ...343 APPENDIX on Program screen ...
Page 354: ...344 APPENDIX ...
Page 355: ...345 APPENDIX ...
Page 356: ...346 APPENDIX ...
Page 357: ...347 APPENDIX ...
Page 358: ...348 APPENDIX ...