

176
CHAPTER 7
for US
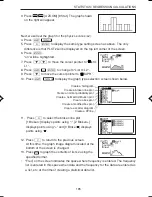
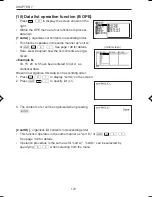
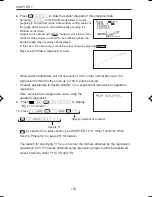
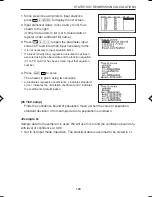
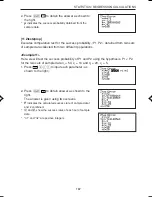
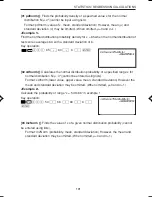
8. Press
A9
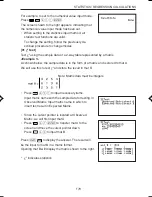
to draw the scatter diagram of this statistical data.
*
Selecting
A9
in the ZOOM mode allows for quick
graphing in an optimum range since window setting values of
the graph plotting screen are automatically set using the
Window set list data.
*
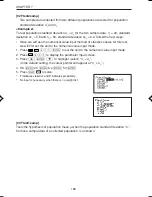
Graphs can be drawn using
; however, since the current
window setting values are used for the statistical graph, the
desired graph may not always be displayed.
In this case, it is necessary to reset the screen range by pressing
WINDOW
.
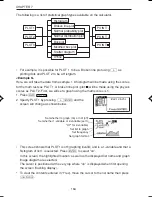
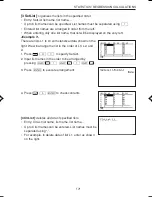
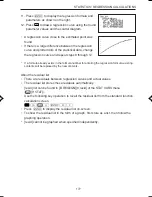
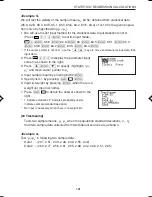
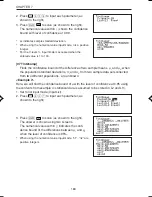
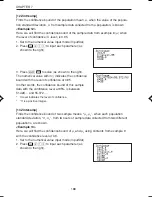
• Next, we will draw a regression curve.
• Since water temperature will not rise above 100°C under normal pressure, the
regression formula for the curve up to 100°C point is solved.
• It seems appropriate to decide whether it is a exponential regression or quadratic
regression.
Here, we will draw a regression curve using the
quadratic regression.
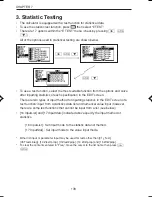
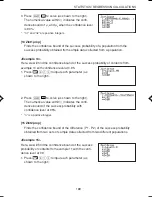
9. Press
¬
D04
to display
“Rg_x
2
” on-screen.
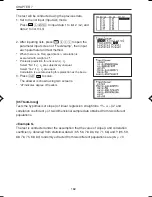
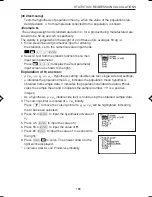
10. Press
(Ï
,Ï
,
Specify objective list number
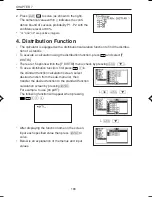
*
is explained in a later section (see CHAPTER 12 “6. Other Functions Often
Used in Programs” on page 251 for details)
• The reason for specifying Y1 here is to store the formula obtained by the regression
calculation to Y1 (Formulas obtained using regression graphs cannot be displayed
unless stored to either Y1 to Y9, and Y0).
A®A1)
Specify Y1
,
,
EL-9650-(07)En (157-177)
8/1/00, 9:06 AM
176
Summary of Contents for EL-9650
Page 10: ...viii ...
Page 46: ...36 CHAPTER 1 ...
Page 230: ...220 CHAPTER 9 ...
Page 268: ...258 CHAPTER 12 ...
Page 349: ...339 APPENDIX When coordinate system is Rect param or polar ...
Page 350: ...340 APPENDIX When coordinate system is Seq F STYLE2 E STYLE1 ...
Page 352: ...342 APPENDIX ...
Page 353: ...343 APPENDIX on Program screen ...
Page 354: ...344 APPENDIX ...
Page 355: ...345 APPENDIX ...
Page 356: ...346 APPENDIX ...
Page 357: ...347 APPENDIX ...
Page 358: ...348 APPENDIX ...