
92
CHAPTER 4
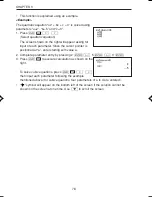
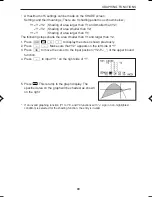
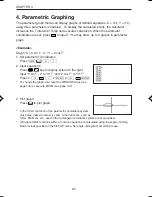
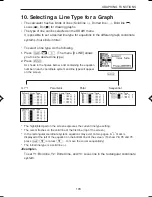
4. Parametric Graphing
The parameter graph mode can display graphs of defined equations (X = X(t), Y = Y(t))
using three parameters (variables). To display the calculated points, the calculator
increases the T interval of Tstep and executes calculation. When the parameter
coordinates are set, press
to input T. You may draw up to 2 graphs in parameter
graph.
<Example>
Graph “X = 3 sin T - 2”, “Y = 2 cos T”.
1. Set parametric coordinates.
Press
Ï
E
2
.
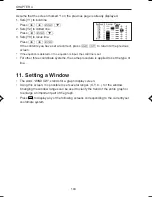
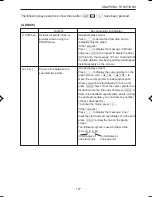
2. Input equations.
Press
key to display screen to the right.
Input “3 sin T - 2” to “X1T” and “2 cos T” to “Y1T”.
Press 3
s
-
2
®
2
c
®
.
*
To change the graph size, reset the WINDOW value (see
page 104) or execute ZOOM (see page 100).
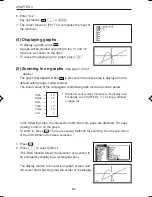
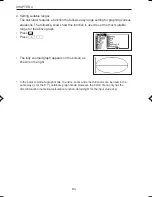
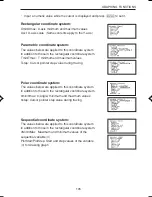
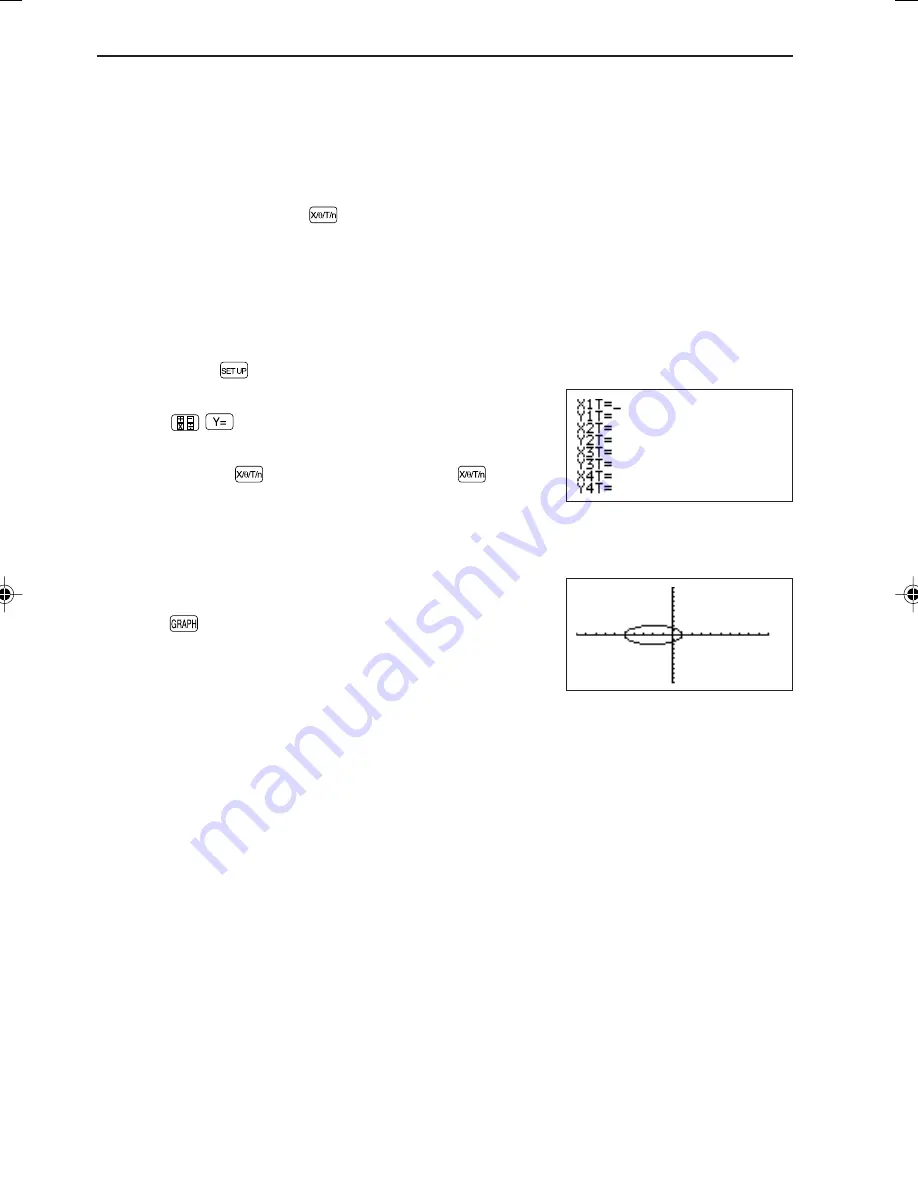
3. Plot graph.
Press
to plot graph.
*
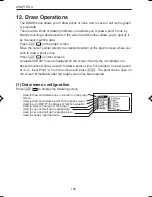
In the CALC functions of the parametric coordinate system,
only Value (numeric value) is valid. Other functions, such as
Intsct, Minimum, etc., used in the rectangular coordinate system are not provided.
*
All trigonometric functions within a function equation are calculated using the angle unit (Deg,
Rad or Grad) specified in the SET UP menu. Set angle unit system according to use.
EL-9650-(04)En (079-134)
8/7/00, 9:07 PM
92
Summary of Contents for EL-9650
Page 10: ...viii ...
Page 46: ...36 CHAPTER 1 ...
Page 230: ...220 CHAPTER 9 ...
Page 268: ...258 CHAPTER 12 ...
Page 349: ...339 APPENDIX When coordinate system is Rect param or polar ...
Page 350: ...340 APPENDIX When coordinate system is Seq F STYLE2 E STYLE1 ...
Page 352: ...342 APPENDIX ...
Page 353: ...343 APPENDIX on Program screen ...
Page 354: ...344 APPENDIX ...
Page 355: ...345 APPENDIX ...
Page 356: ...346 APPENDIX ...
Page 357: ...347 APPENDIX ...
Page 358: ...348 APPENDIX ...