
177
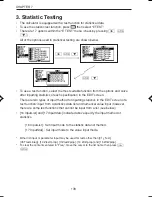
STATISTICS/ REGRESSION CALCULATIONS
for US
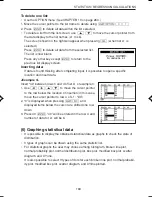
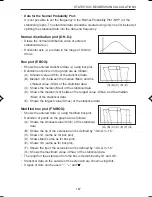
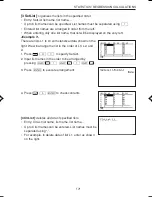
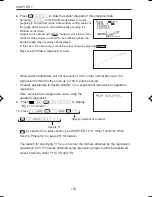
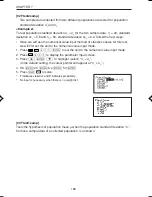
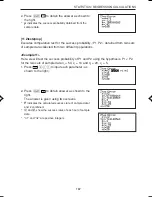
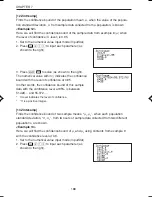
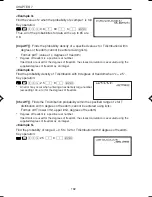
11. Press
®
to display the regression formula and
parameters as shown on the right.
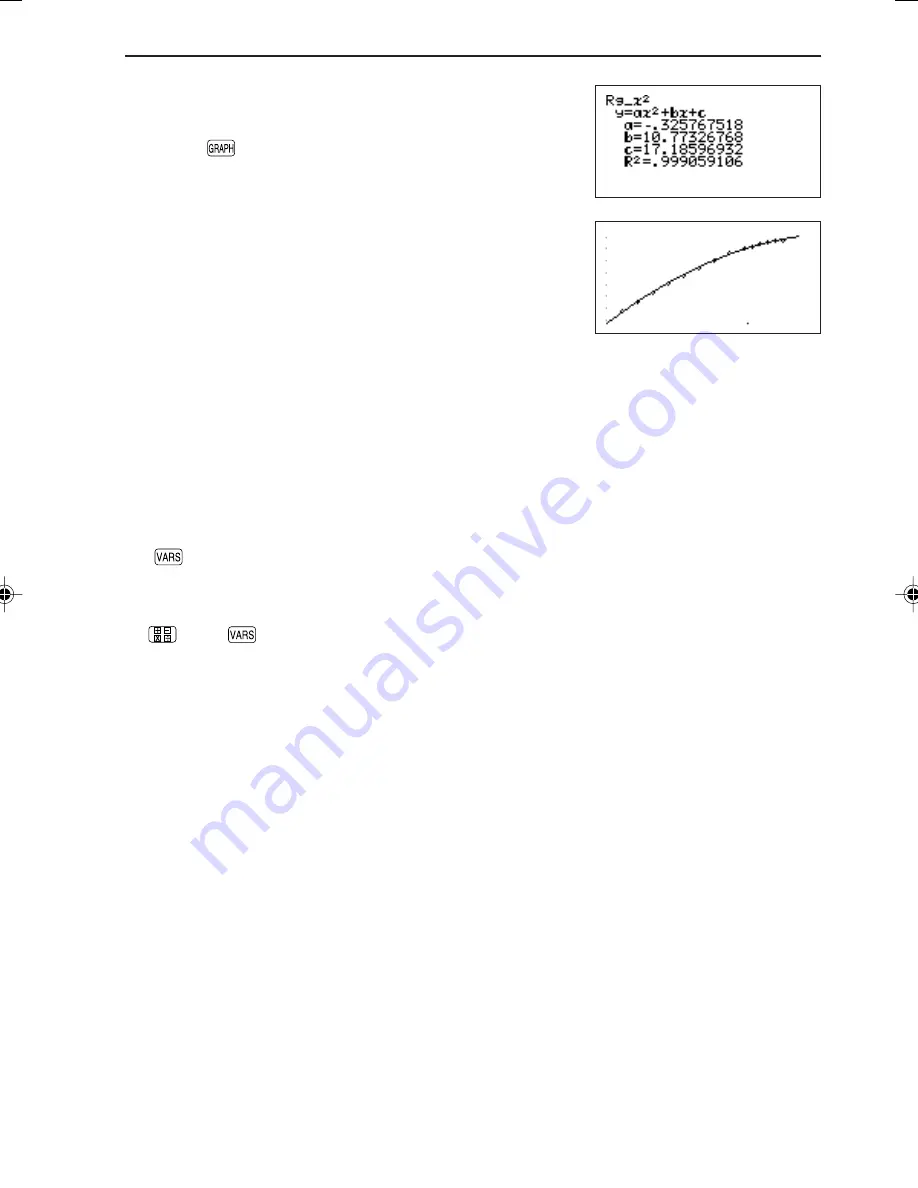
12. Press
to draw a regression curve using the found
parameter values and the scatter diagram.
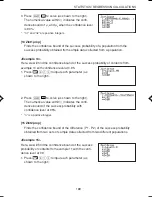
• A regression curve close to the estimated point was
found.
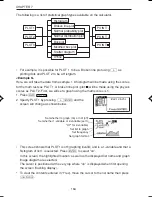
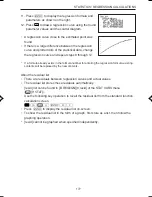
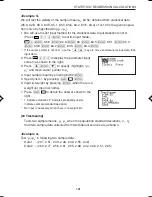
• If there is a large difference between the regression
curve and plotted dots of the statistical data, change
the regression curve and repeat steps 9 through 12.
*
If a formula already exists in the formula number for entering the regression formula, existing
contents will be replaced by the new contents.
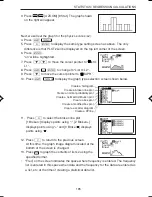
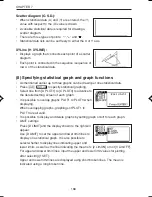
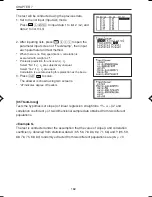
About the residual list
• There are residuals between regression curves and actual values.
• The residual list stores these residuals automatically.
• [resid] list can be found in [B REGEQN][0 resid] of the STAT VARS menu
(
[H STAT]).
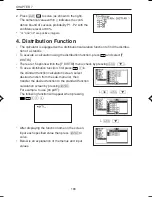
• Use the following key operation to recall the residual list from the standard function
calculation screen.
¬
H®B0
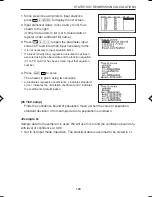
• Press
®
to display the residual list on-screen.
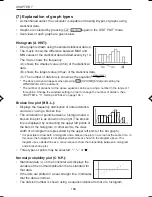
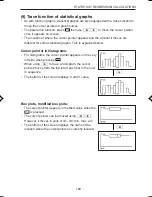
• To show the residual list in the form of a graph, first store as a list, then follow the
graphing operation.
* [resid] cannot be graphed when specified independently.
EL-9650-(07)En (157-177)
8/1/00, 9:06 AM
177
Summary of Contents for EL-9650
Page 10: ...viii ...
Page 46: ...36 CHAPTER 1 ...
Page 230: ...220 CHAPTER 9 ...
Page 268: ...258 CHAPTER 12 ...
Page 349: ...339 APPENDIX When coordinate system is Rect param or polar ...
Page 350: ...340 APPENDIX When coordinate system is Seq F STYLE2 E STYLE1 ...
Page 352: ...342 APPENDIX ...
Page 353: ...343 APPENDIX on Program screen ...
Page 354: ...344 APPENDIX ...
Page 355: ...345 APPENDIX ...
Page 356: ...346 APPENDIX ...
Page 357: ...347 APPENDIX ...
Page 358: ...348 APPENDIX ...