
82
CHAPTER 4
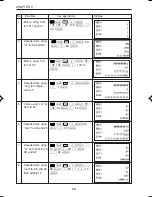
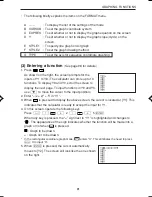
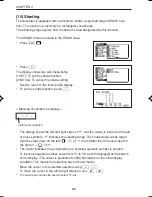
6. Enter “X–2”.
Key operations:
-
2
®
7. The cursor moves to [Y3]. This completes the input of
the functions.
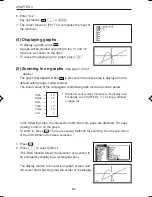
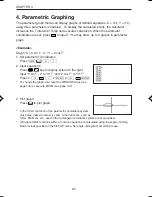
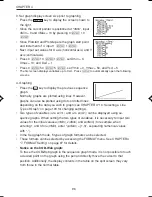
(4) Displaying graphs
• To display a graph, press
.
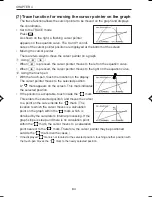
• A graph will be created according to the Y1 and Y2
functions, as shown on the right.
• To cancel the displaying of a graph, press
˚
.
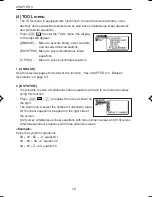
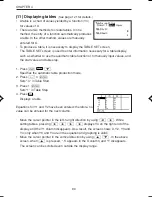
(5) Zooming in on graphs
(See page 100 for
details.)
• The graph that appears when
is pressed in the above step is displayed in the
default setting range, called window.
• The initial values of the rectangular coordinate graph mode are shown below.
Xmin
=
-10
Xmax =
10
Xscl
=
1
Ymin
=
-10
Ymax =
10
Yscl
=
1
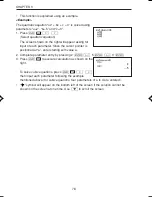
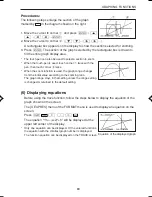
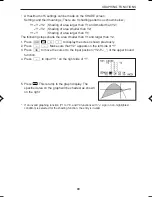
• In the following steps, the intersection and maximum value are obtained. For easy
viewing, zoom in on the graph.
• To zoom in, press
. There are several methods for zooming. Use the sub-menu
of the ZOOM menu to make a selection.
1. Press
.
2. Press
2
to select [2 Box].
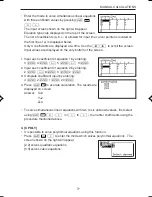
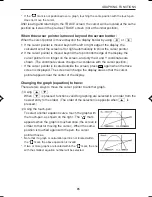
(The BOX function allows the selection of a section to
be enlarged by displaying a rectangular box.)
The display returns to the previous graph screen, and
the cursor starts flashing near the center of the display.
*
Window means settings that specify the display area.
For details, see CHAPTER 4, “11. Setting a Window”
on page 104.
EL-9650-(04)En (079-134)
8/7/00, 9:07 PM
82
Summary of Contents for EL-9650
Page 10: ...viii ...
Page 46: ...36 CHAPTER 1 ...
Page 230: ...220 CHAPTER 9 ...
Page 268: ...258 CHAPTER 12 ...
Page 349: ...339 APPENDIX When coordinate system is Rect param or polar ...
Page 350: ...340 APPENDIX When coordinate system is Seq F STYLE2 E STYLE1 ...
Page 352: ...342 APPENDIX ...
Page 353: ...343 APPENDIX on Program screen ...
Page 354: ...344 APPENDIX ...
Page 355: ...345 APPENDIX ...
Page 356: ...346 APPENDIX ...
Page 357: ...347 APPENDIX ...
Page 358: ...348 APPENDIX ...