


------------------------------- Physical Layer: Eye & Jitter --------------------------------
Ultra v2.0a User Guide
S-9
S.3.3 Jitter Spectrum
(Requires PHY_ADV)
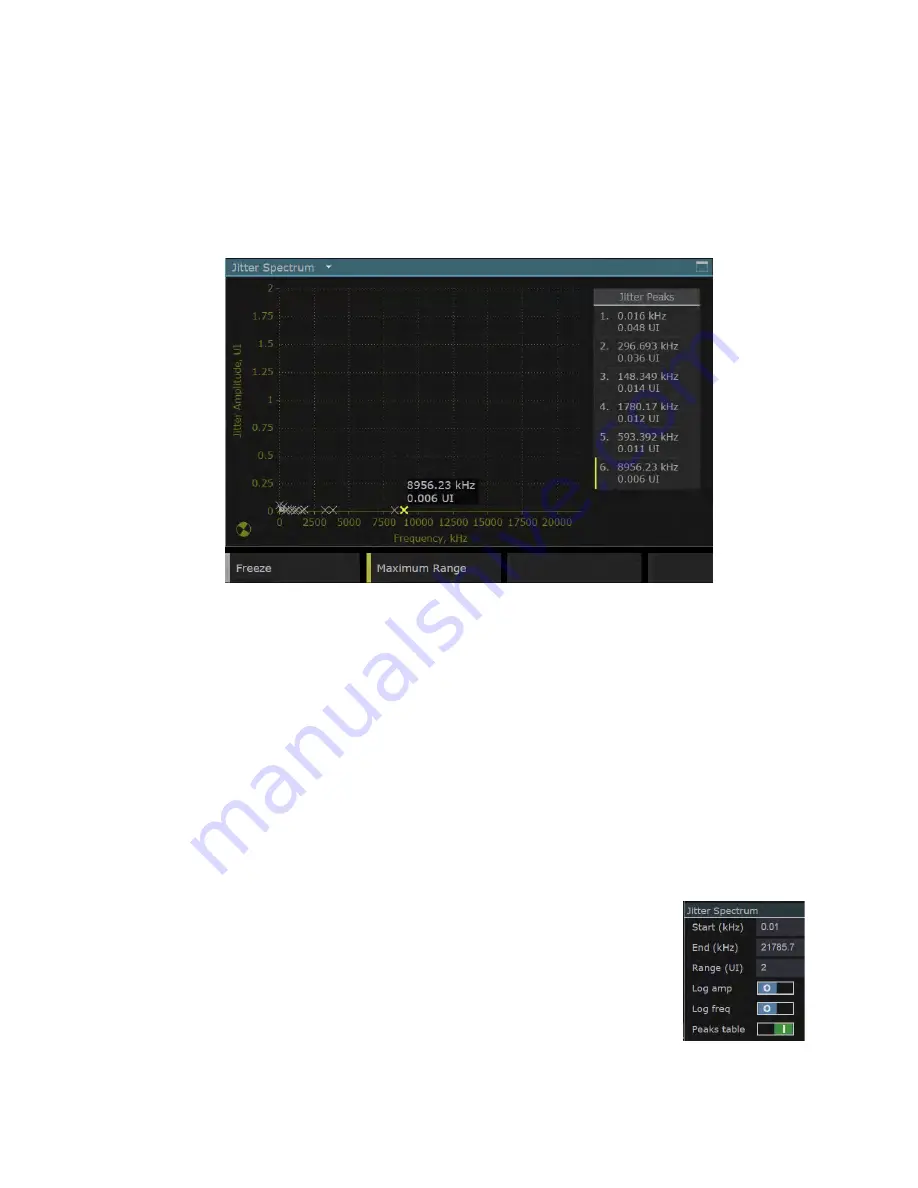
The Jitter Spectrum display comprises a graph showing the highest peaks of a Fourier Transform of
the jitter within the carrier signal that is being analysed. More accurately, it provides a window on this
set of peaks. You specify the frequency range you are interested in and the range of jitter amplitude
values you wish to display and a graph is drawn showing the peak jitter amplitudes that appear within
the selected range.
Up to 15 peaks are shown, subject to a minimum threshold of 0.001UI. The positions calculated
for the peaks are accurate to 5Hz.
Figure S-10:
Jitter Spectrum display
A ‘Peaks table’, showing the frequency and the jitter amplitude of the peaks within the chosen
frequency range, is optionally shown alongside the graph. The peaks are listed in order of
magnitude, starting with the highest. When the Jitter Spectrum is shown full screen, there will
typically be plenty of room to show details of all the peaks in the selected range: in quad-split
mode, just the 6 or 7 highest peaks in the range will be shown.
Both amplitude values and frequency values can be scaled logarithmically to show small values
of either parameter more clearly. You also have the option of freezing the display to allow further
inspection, including looking at parts of the frequency spectrum that are not currently shown.
The peaks are normally marked by white crosses. When you hover the cursor over a peak in the
graph, however, both the cross and the corresponding entry in the Peaks table become highlighted
and a tool-tip is displayed showing the frequency and the amplitude at that peak. Similarly, if you
click on one of the entries in the table, both the entry and the corresponding peak in the graph are
picked out as above.
The upper frequency bound for this analysis is very much higher than for Jitter
Meters. Frequencies up to approximately 22MHz can be analysed. A quick key
is provided that switches from the current frequency range to the maximum
possible range. Alternatively, you can set the particular range you are interested
in by editing the
Start
and
End
values given in the right-hand panel when the
Jitter Spectrum display is selected. Alternatively again, clicking on a peak zooms
the frequency to a shorter range around that point, Ctrl-click zooms the graph out
and rotating the mouse-wheel zooms in/out about the frequency at the cursor
position. You can also scroll the graph left and right by clicking and dragging
one of the peaks (though currently this only works in linear frequency mode).
Figure S-11:
Jitter Spectrum
Properties.
Summary of Contents for Ultra 4K Tool Box
Page 1: ...Ultra 4K Tool Box User Guide Version 2 0a August 2015...
Page 8: ...General Ultra v2 0a User Guide...
Page 50: ...General Automated Control Ultra v2 0a User Guide C 6...
Page 52: ...Conversion Facilities Ultra v2 0a User Guide...
Page 62: ...Signal Analysis Ultra v2 0a User Guide...
Page 96: ...Signal Analysis Status Ultra v2 0a User Guide O 4...
Page 98: ...Physical Layer Analysis Ultra v2 0a User Guide...
Page 112: ...Physical Layer Eye Jitter Ultra v2 0a User Guide S 14...
Page 118: ...Generator Ultra v2 0a User Guide...
Page 134: ...Generator Creating Test Patterns W 8 Ultra v2 0a User Guide...
Page 139: ...Ultra v2 0a User Guide...


