103 of 112
14.12 TagScan
To represent the relationship between the tag phase and the RSSI value, it is possible to plot both values by means of
the TagScan.
✔ Ther
e is only one tag in the field or a tag has been selected.
►
Click
Start
to activate the TagScan.
➯
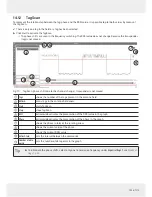
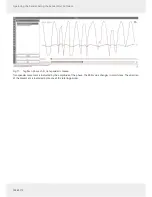
The phase shifts are seen in the frequency switching. The RSSI value does not change because the transponder
(tag) is not moved.
2
3
1
4
5
6
7
8
9
10
11
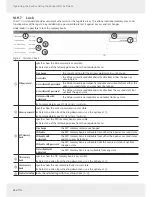
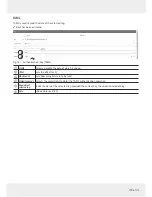
Fig. 70: TagScan: phase shift (due to the channel change), transponder is not moved
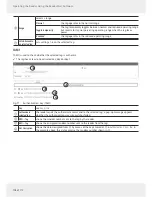
①
Tags
shows the number of the tags pr
esent in the antenna field
②
Refresh
scans tags in the antenna field anew
③
Start
starts TagScan
④
Stop
stops TagScan
⑤
RSSI
activates/deactivates the presentation of the RSSI value in the graph
⑥
Phase
activates/deactivates the presentation of the phase in the graph
⑦
shows the phase in form of the rotating arrow
⑧
shows the current value of the phase
⑨
shows the current RSSI value
⑩
Refresh rate
sets the interval between the commands
⑪
Number of data
points
sets the number of data points in the graph
Tip
►
To eliminate the phase shifts, select only one transmission frequency under
Expert settings 1
; see
Expert Set-
tings 1, p. 85
.

