


DIFF SCATTERPLOTS AND HISTOGRAMS
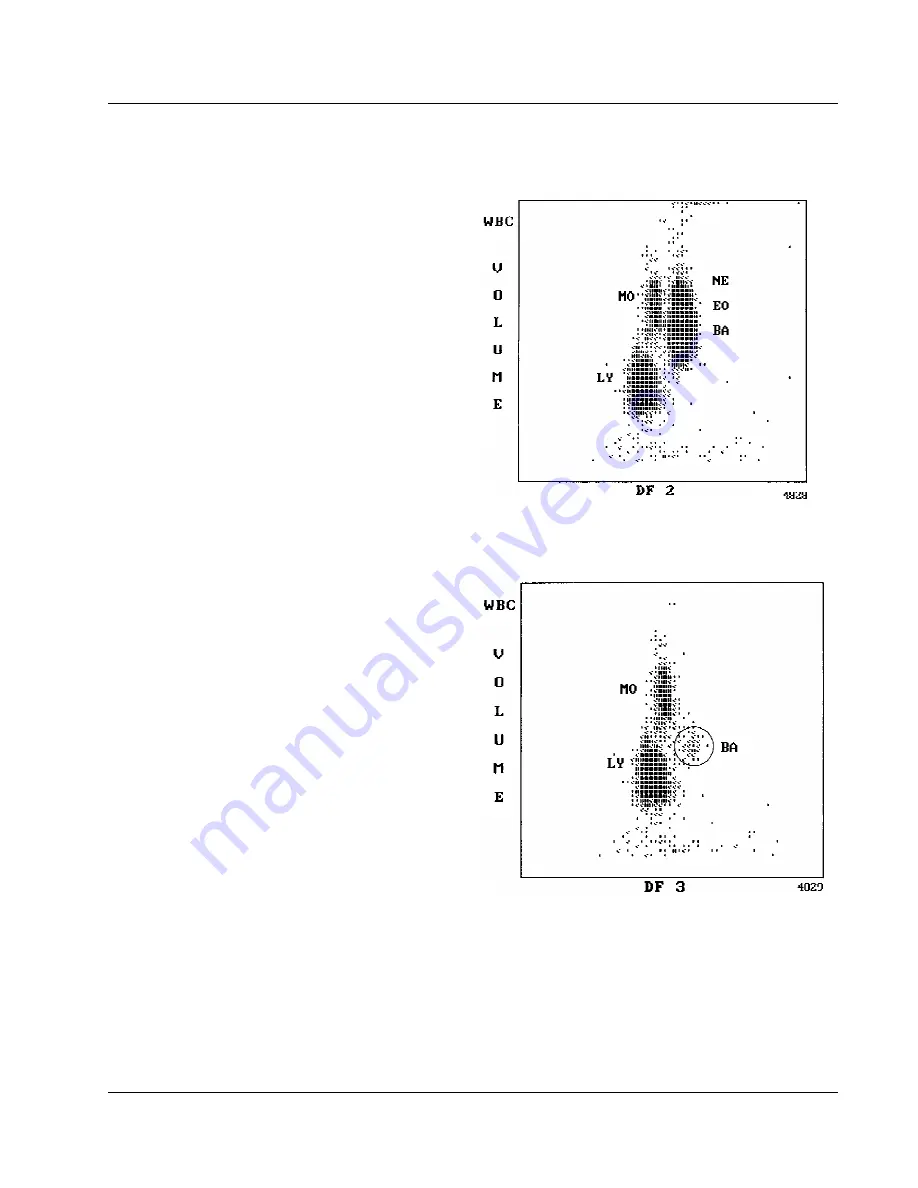
DF 2 Scatterplot
DF 2 is derived primarily from conductivity.
From this perspective, lymphocytes, monocytes
and granulocytes are the prominent populations.
The granulocytes include the neutrophils,
basophils and eosinophils.
DF 3 Scatterplot
DF 3 displays the same data as DF 2 with the
neutrophil and eosinophil populations gated out.
Basophil, lymphocyte and monocyte cell
populations exhibit pronounced distinction when
viewed from this perspective.
PN 4237188A (December 1993)
77
Summary of Contents for STKS
Page 16: ...CONTROLS AND INDICATORS 6 PN 4237188A December 1993...
Page 84: ...SAMPLE ANALYSIS 74 PN 4237188A December 1993...
Page 98: ...DATA ANALYSIS 88 PN 4237188A December 1993...
Page 124: ...DMS BASICS 114 PN 4237188A December 1993...
Page 130: ...RUN SAMPLES DISPLAY 120 PN 4237188A December 1993...
Page 168: ...DATA BASE 158 PN 4237188A December 1993...
Page 204: ...APPENDIX A 194 PN 4237188A December 1993...
Page 216: ...APPENDIX C 206 PN 4237188A December 1993...
Page 228: ...APPENDIX D 218 PN 4237188B March 1995...
Page 230: ...REFERENCES 220 PN 4237188B March 1995...
Page 236: ......