


DATA ANALYSIS
DIFF SCATTERPLOTS AND HISTOGRAMS
STKS diff reagents maintain white cells in their
near native state.
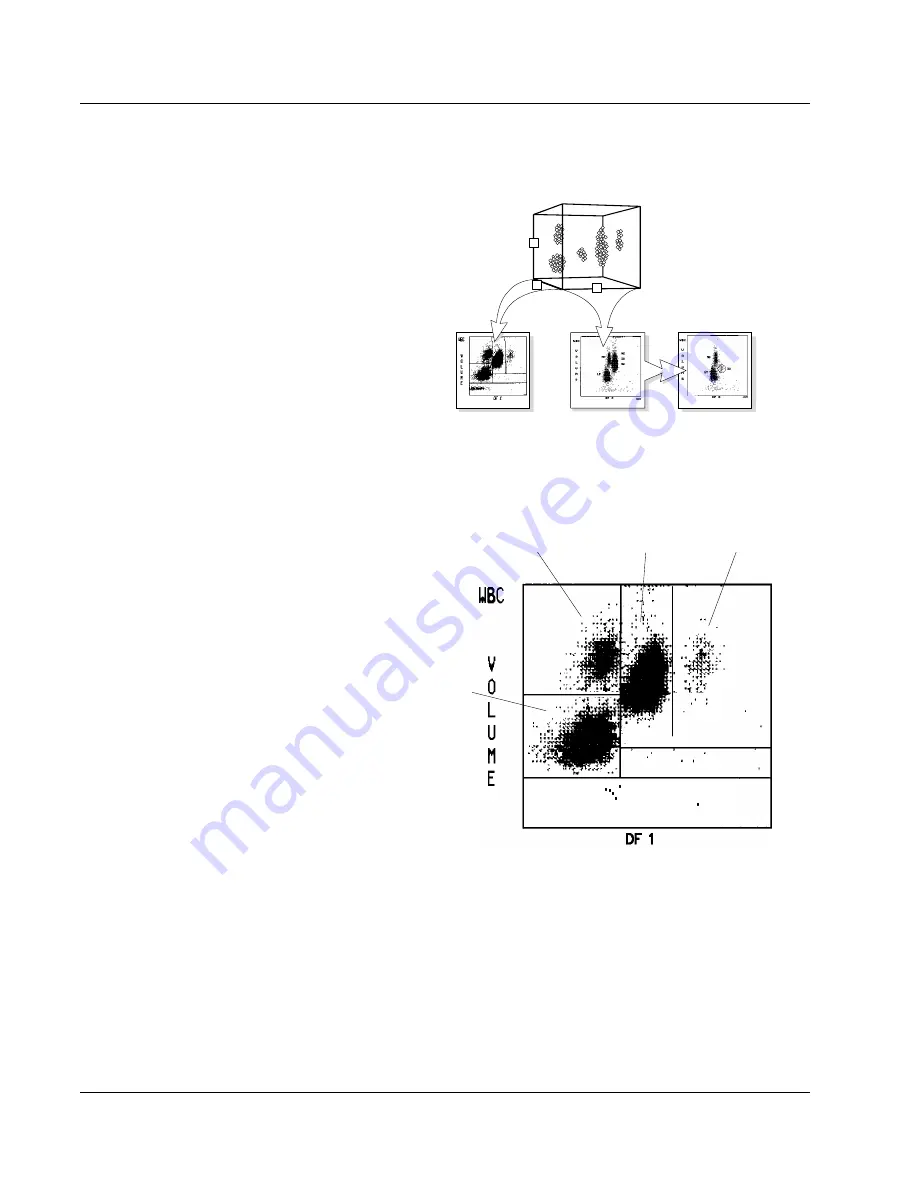
The STKS looks at cells in all three dimensions.
You see results on your screen
•
two dimensions at a time
•
in three different views.
D F 3
D F 2
D F 1
C
S
V
5 9 3 5 - 0 2 3
DF 1 Scatterplot
DF 1 (Discriminant Function 1) is the scatterplot
that automatically appears with CBC/Diff sample
data. It is derived primarily from volume and
light scatter. The Y-axis represents volume, and
the X-axis light scatter. Lymphocytes, monocytes,
neutrophils, and eosinophils are shown with high
resolution. The basophil population is brought
into view as the three-dimensional axis is rotated
to present the DF 3 display.
5935-24
EO
NE
MO
LY
76
PN 4237188A (December 1993)
Summary of Contents for STKS
Page 16: ...CONTROLS AND INDICATORS 6 PN 4237188A December 1993...
Page 84: ...SAMPLE ANALYSIS 74 PN 4237188A December 1993...
Page 98: ...DATA ANALYSIS 88 PN 4237188A December 1993...
Page 124: ...DMS BASICS 114 PN 4237188A December 1993...
Page 130: ...RUN SAMPLES DISPLAY 120 PN 4237188A December 1993...
Page 168: ...DATA BASE 158 PN 4237188A December 1993...
Page 204: ...APPENDIX A 194 PN 4237188A December 1993...
Page 216: ...APPENDIX C 206 PN 4237188A December 1993...
Page 228: ...APPENDIX D 218 PN 4237188B March 1995...
Page 230: ...REFERENCES 220 PN 4237188B March 1995...
Page 236: ......