CTD-N Technical Manual
P/N 95F-6000-00 (February 2017)
page 63
EAR-Controlled Technology Subject to Restrictions Contained on the Cover Page.
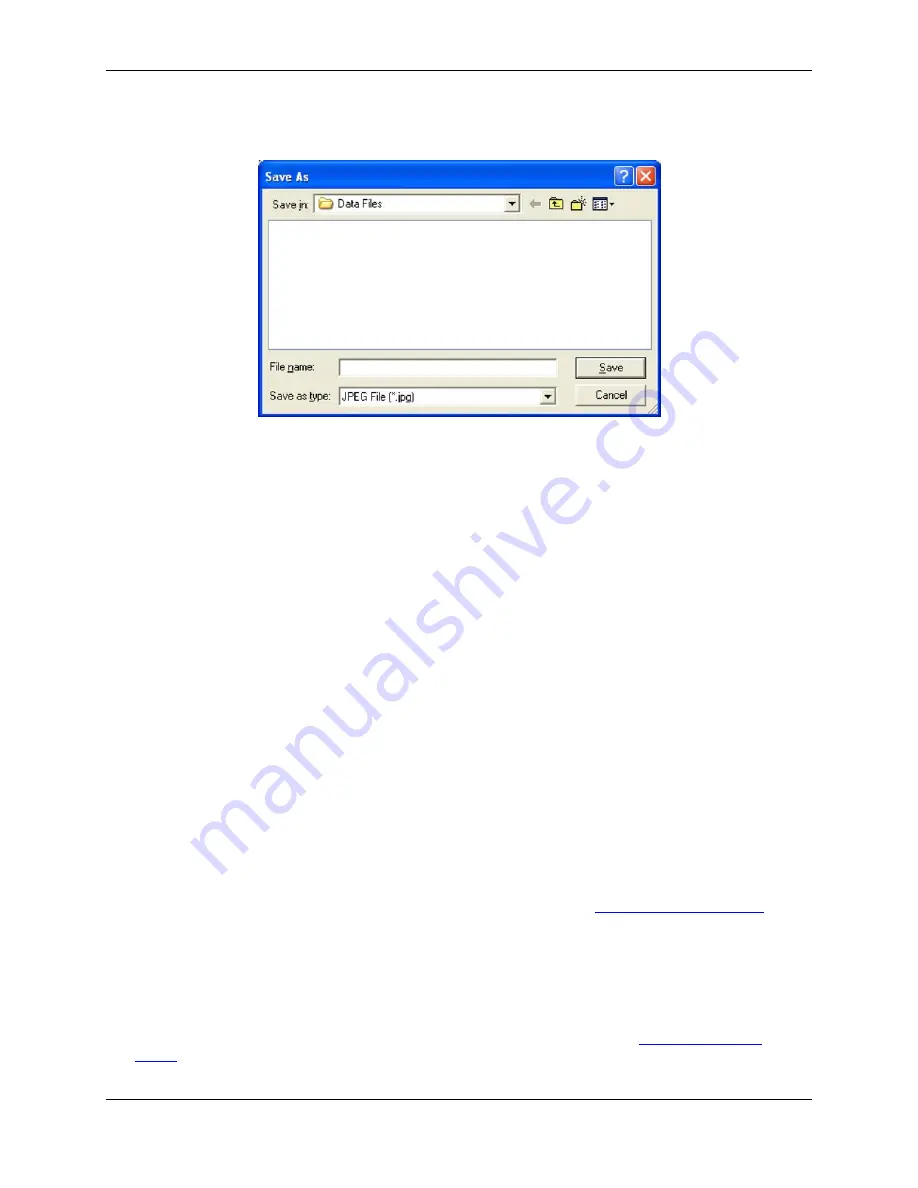
The Save As dialog box for image files shown in Figure 35 opens. This dialog box is used to
create the file in which to save the image file.
Figure 35.
The Save As Dialog Box for Image Files
4. Click the arrow in the Save in drop-down list box and select the folder in which to save the
image file.
5. In the File name text box enter the name of the file in which to save the data. The extension
.jpg is added automatically.
6. Click Save.
The Save As dialog box for image files closes.
7. Enter the quality of the image—as an integer from 0 to 100—in the Quality text box in the
Save Graph dialog box. The higher the number the higher the quality and the larger the file
size.
8. If a grayscale image is desired, select the Grayscale check box.
9. To compress the image and reduce the file size, select the Compress Image check box.
10. Click OK.
The graph is saved and can be opened in any image editor.
Previewing and Printing a Graph
To print a graph without previewing, view the graph as described in
choose File
➤
Print, and then follow the printing instructions for your printer. To set up the printer
or select a different one, choose File
➤
Print Setup.
To preview the printed graph, choose File
➤
Print Preview.
Viewing File Information
To view file information about the data file, view the graph as described in
, and then click Data Summary. The File Information window shown in Figure 36 opens. The


