


expressed in milliseconds.
The MLR is the peak estimated number of lost MPEG-2 Transport Stream packets inside
any second within the actual time period. The number of lost TS packets is derived
from the continuity counters inside the TS packet headers.
A common scenario is to have 7 TS packets per UDP frame. Losing an IP packet will
therefore usually (but not always) result in an MLR of 7 (not always the case because
some TS packets such as null pacets or PCR packets do not carry a valid CC field).
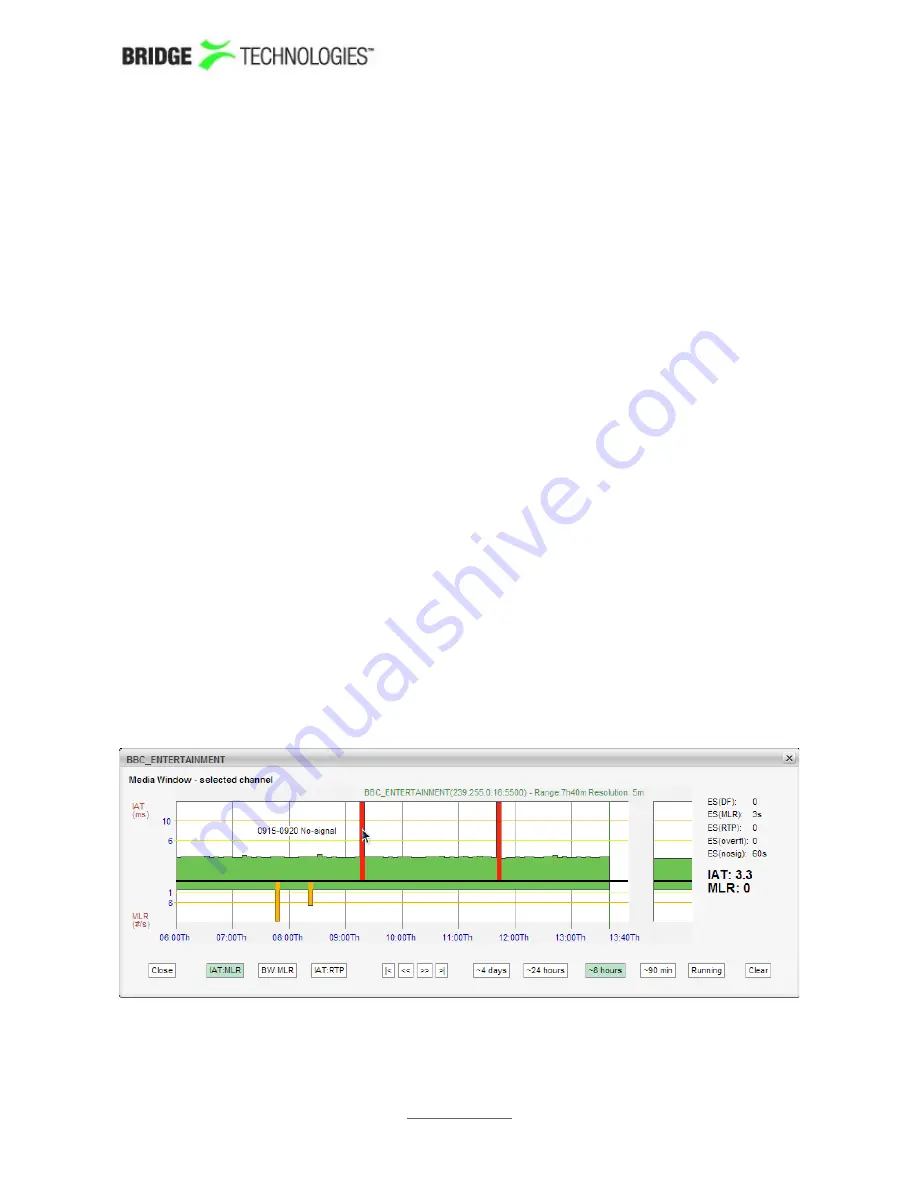
Bridge Technologies' patented
Media Window
presents both jitter and packet loss
measurements in one graph, with jitter (IAT) values growing upwards (+ve Y) and
packet loss (MLR) growing downwards (-ve Y). Each sample along the x-axis
corresponds to a measurement time-interval that depends on the range of the graph
selected. Periods of no sync are also displayed in the graph.
Error-second statistics for the graph-interval is displayed to the right. As the graphs
are zoomed or scrolled the error-second statistics is updated as well as the graphs.
Tool-tip provides the exact jitter (IAT) and packet loss (MLR) values for a selected bar in
a selected graph, the denotation is IAT::MLR. The current graph value displayed under
“Running” provides the maximum MLR and IAT values measured during the last 3
seconds.
Red colour is used to indicate that within the period represented by the bar there has
been one or more occurrences of no-signal. Orange is used to indicate error while
yellow indicates warning. The error and warning thresholds are allocated to each
multicast in the
Ethernet - Multicasts
view.
The user determines whether only multicasts associated with the currently selected
page should be displayed (by clicking the
Cur page
button), or if all joined multicasts
should be presented in one list (by clicking the
All
button). The time window buttons
allow selection of x-axis resolution in the graphs, and by using the arrow buttons it is
possible to move the timeline to view an error incident more accurately. Clicking
Clear
will clear all graphs. Note that clearing graphs cannot be undone. Clicking the
+
1
button will display the next page. Clicking the
-
1
button will display the previous page.
By zooming and panning the user can pinpoint more accurately when errors occurred.
PROBE USERS' MANUAL VERSION 5.0
2014 © BRIDGE Technologies Co AS - Bentsebrugata 20 - N-0476 Oslo, Norway - tel: +47 22 38 51 00
-
www.bridgetech.tv
88