


Thumb:
Click the icon to access the
Thumb
pop-up view
Type:
The list entry service type or PID type
PCR:
This field will be checked if the corresponding PID carries PCR
Scr:
This field will be checked if the corresponding PID is scrambled
Under this list the
Mon - Parameters (Current parameters)
measurements for the
selected stream are displayed.
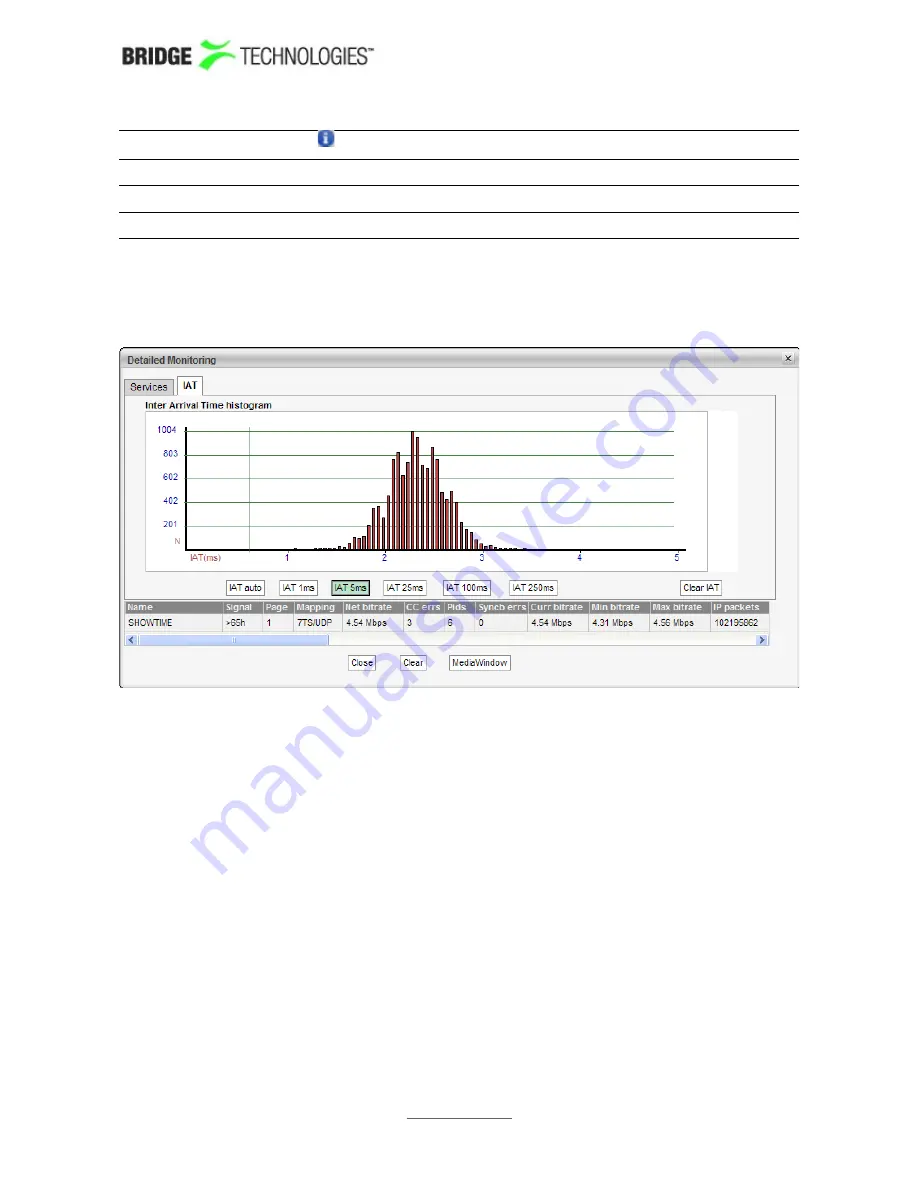
In the
Detailed Monitoring - IAT
view the
Inter Arrival Time histogram
shows the
accumulated number of IAT measurements within each presented interval. Vertical
green lines indicate the maximum and minimum IAT values. By clicking the IAT range
buttons it is possible to change the zooming of the graph. If the
IAT auto
button is
pressed the diagram will auto-scale to always include the minimum and maximum IAT
readings.
The IAT histogram is a very useful and intuitive measure of how well the network is
performing in terms of forwarding real-time traffic. A predictable and tightly bunched
graph indicates small levels of network jitter. An unbound graph indicates network
jitter issues typically brought forward by traffic congestion or misconfigured routers.
Clicking the
Clear IAT
button will clear the IAT graph.
Under the IAT histogram the
Mon - Parameters (Current parameters)
measurements for the selected stream are displayed.
Clicking the
Clear
button will clear all information about the selected stream,
including PSI/SI analysis data.
Clicking the
MediaWindow
button will open the Media Window
Selected channel
view. This is described in section 6.5.
PROBE USERS' MANUAL VERSION 5.0
2014 © BRIDGE Technologies Co AS - Bentsebrugata 20 - N-0476 Oslo, Norway - tel: +47 22 38 51 00
-
www.bridgetech.tv
82