


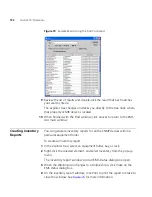
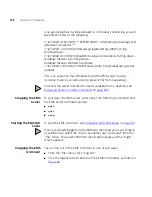

Monitoring Numeric Properties
183
Monitoring
Numeric Properties
You can view a dynamic line graph to monitor any numeric property in
EMS. Each graph scrolls continuously according to the poll rate, which
has a default of five seconds. You can view graphs for as many properties
as you want at the same time.
To monitor a numeric property:
1
In the explorer tree, select an element that contains a numeric value.
2
Select any numeric property from the right pane of the main EMS
window.
3
Right-click the property, and select
Monitor
from the pop-up menu.
A monitor dialog box opens with specific information about the property.
You may display as many property monitors as you want. The display will
update as often as set by the Poll Rate. To change the poll rate, see
Setting the Poll Rate
on
page 183
.
4
Click
Start
to begin monitoring.
The graphing starts, based on the poll rate value. While the graphing
proceeds, the
Start
button is replaced by the
Pause
button. Use the
Pause
button to interrupt the graphing process.
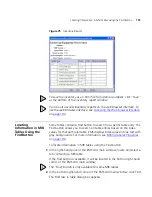
5
To change the rate (the default is five second) see
Setting the Poll Rate
on
page 183
below.
6
Click
Close
to exit the monitor dialog box.
Setting the Poll Rate
The poll rate determines how often the property monitor is updated
(refreshed).
To set the poll rate:
1
Open a monitor for a particular property, as described in
Monitoring
Numeric Properties
on
page 183
.
2
Click
Poll Rate
at the bottom of the monitor dialog box.
The Polling Rate dialog box appears.
3
Type a new polling rate, in seconds.
4
Click
OK
.
Summary of Contents for 3CR15600 - Enterprise Management Suite
Page 12: ...12 ...
Page 16: ...16 ABOUT THIS GUIDE ...
Page 40: ...40 CHAPTER 1 PRODUCT OVERVIEW ...
Page 54: ...54 CHAPTER 2 PRE INSTALLATION ...
Page 100: ...100 CHAPTER 4 SERVER FAILOVER CONFIGURATION ...
Page 123: ...Schedulable GUI Based Device Discovery 123 Figure 32 Session Preferences Discovery Tab Boxes ...
Page 132: ...132 CHAPTER 6 GUI CLIENT CONFIGURATION ...
Page 166: ...166 CHAPTER 9 NETWORK MANAGEMENT PLATFORM INTEGRATION CONFIGURATION ...
Page 206: ...206 CHAPTER 10 OPERATIONS ...
Page 212: ...212 APPENDIX A COMMAND LINE INTERFACE REFERENCE ...
Page 218: ...218 INDEX ...


