The User Interface
134
The data is then utilised by each screen as it is selected to show the data in a plot, trace or
graphical format. Tapping on the ‘Capture’ button again whilst in any screen will start a new
data capture process, following which the new data set will be utilised by each screen.
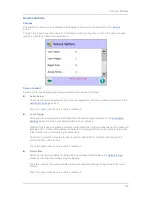
The information displayed in each of the selectable screens is as follows:
■
Settings screen
The Settings screen is selected by default when the Product screen opens. It displays the
detector settings for the currently selected product which are mostly manually entered through
the
Learn Setup
screen and automatically selected by the detector as part of the Learn process.
Some parameters selected in the
Conveyor Setup
screen are also displayed.
■
P,Q v T screen
The P,Q v T screen displays a trace of the raw P and Q channel signals against time. The
Pmax and Qmax values are displayed which may be used when determining the ADC offset
values to use when balancing out the P and Q channel signals in the
PQ Analysis
screen.
■
Phase screen
The Phase screen displays a plot of the P and Q channel signals on the left hand side and a
scatter graph showing the Magnitude (combined P and Q channel signal values) values
captured.
Содержание IQ3+
Страница 2: ......
Страница 36: ...Safety First 26 THIS PAGE IS INTENTIONALLY LEFT BLANK ...
Страница 43: ...Installation 33 ...
Страница 60: ...Installation 50 THIS PAGE IS INTENTIONALLY LEFT BLANK ...
Страница 70: ...About the Metal Detector Range 60 THIS PAGE IS INTENTIONALLY LEFT BLANK ...
Страница 218: ...Operating Instructions 208 THIS IS PAGE INTENTIONALLY LEFT BLANK ...
Страница 244: ...Maintenance 234 THIS PAGE IS INTENTIONALLY LEFT BLANK ...
Страница 248: ...Glossary 238 THIS PAGE IS INTENTIONALLY LEFT BLANK ...


