EasyMatch QC User’s Manual Version 2.1
Lessons
2-5
15.
Right click the data view to the right of the Color Data Table at the top of the screen. Select
Change
View
from the menu that appears and then
2D
Color Plot
. The view will be changed to the 2D
Color Plot. If there is not currently a data view to the right of the Color Data Table, right click on
the Color Data Table and choose
Split View Vertically and Add
and choose
2D
Color Plot
. The
2D Color Plot will be added to the right of the Color Data Table.
16.
Right click the 2D Color Plot view and choose
Configure
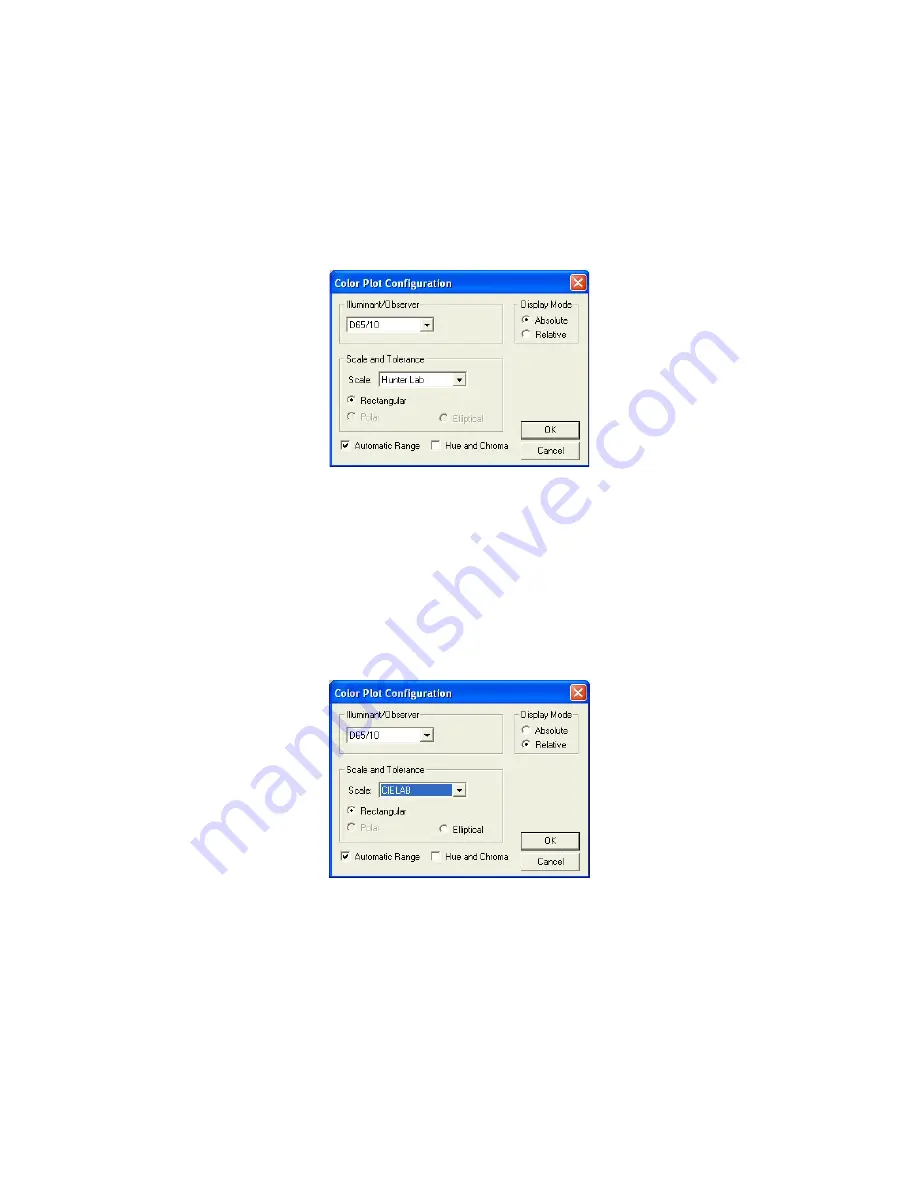
from the menu that appears. The Color
Plot Configuration screen is shown.
17.
Make the following selections on the Color Plot Configuration screen:
Illuminant/Observer
D65/10
Display Mode
Relative
Scales and Tolerances
CIELAB, Rectangular
Automatic Range
Checked
Hue and Chroma
Unchecked
18.
Click
OK
to accept the configuration.
19.
Right-click the 2D Color Plot and select (check) both
Show Background
and
Show Legend
.
20.
Right click the data view across the bottom of the screen. Select
Change View
and then
Trend Plot
from the menu that appears. The view will be changed to the Trend Plot.
21.
Right click the Trend Plot and select
Configure
. The Trend Plot Configuration screen appears.
Содержание EasyMatch QC
Страница 11: ...Part I Software Overview...
Страница 105: ...EasyMatch QC User s Manual Version 2 1 2 50 Lessons...
Страница 112: ...Part II Software Menu Commands...
Страница 140: ...EasyMatch QC User s Manual Version 2 1 3 28 The File Menu...
Страница 150: ...EasyMatch QC User s Manual Version 2 1 3 38 The File Menu...
Страница 156: ...EasyMatch QC User s Manual Version 2 1 5 2 The View Menu Toolbar is not displayed...
Страница 227: ...Part III Instruments...
Страница 290: ...Part IV Reference...
Страница 325: ...EasyMatch QC User s Manual Version 2 1 Measurement Values A 35...


