EasyMatch QC User’s Manual Version 2.1
1-20
Introduction to EasyMatch QC
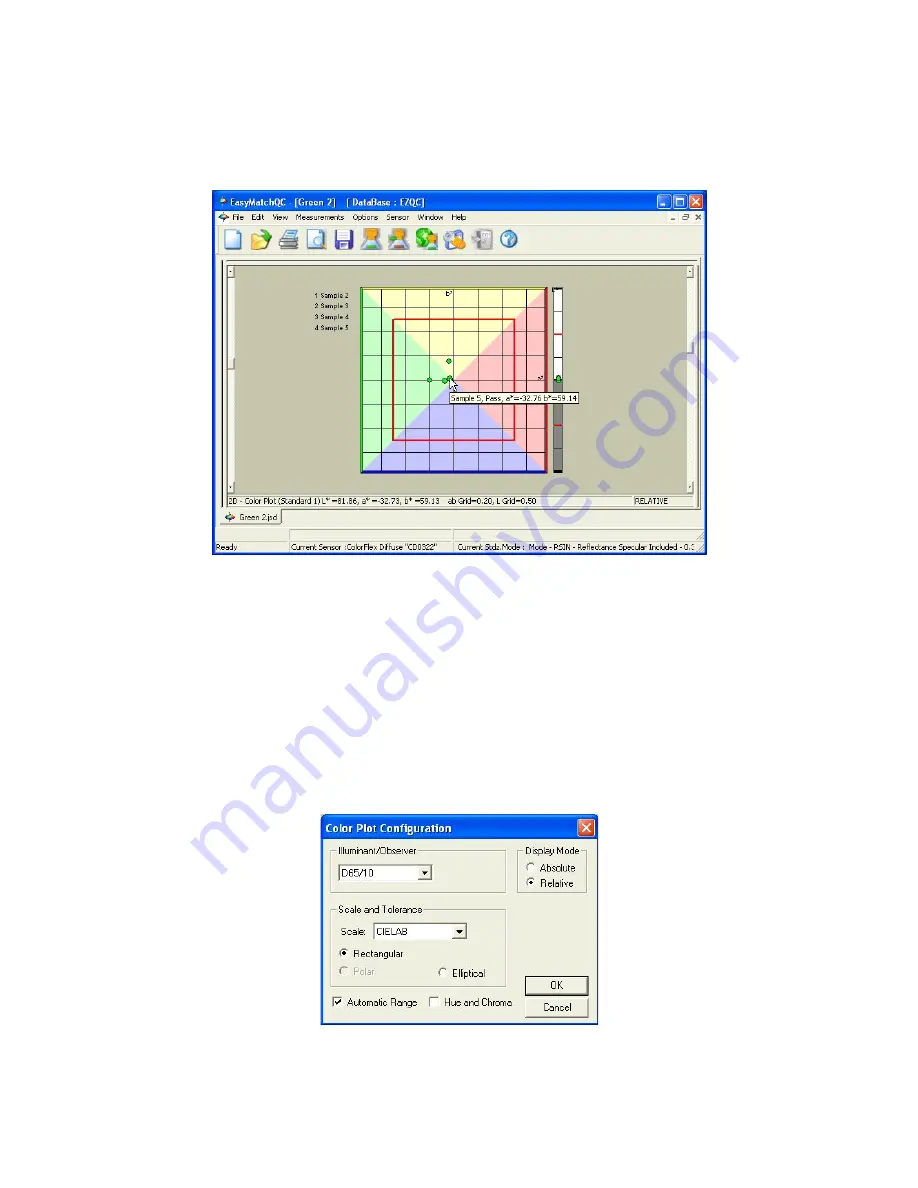
on the plot relative to the standard and each other. If tolerances have been set, the tolerance limits will
be shown as a red box (for rectangular tolerances), ellipse (for elliptical tolerances), or “pie segment”
(for polar tolerances) around the standard position. Placing the mouse over a particular point causes the
sample ID, its pass or fail status, and its color values to be displayed.
Click on this view to make it active. While this view is active, the following options are available by
clicking the right mouse button:
•
Show Background:
This item, when checked, causes the colored background to be shown on the
2D Color Plot. When unchecked, the background is white.
•
Show Legend:
This item, when checked, causes the legend (the list of which samples are currently
displayed) to be shown to the left of the 2D Color Plot. When unchecked, the legend is not shown.
•
Configure:
This command allows you to set various preferences pertaining to the 2D Color Plot
view.
Make your selections for each parameter, including the illuminant, observer, and color scale for
display and the whether the hue circle and chroma line should be displayed.
Содержание EasyMatch QC
Страница 11: ...Part I Software Overview...
Страница 105: ...EasyMatch QC User s Manual Version 2 1 2 50 Lessons...
Страница 112: ...Part II Software Menu Commands...
Страница 140: ...EasyMatch QC User s Manual Version 2 1 3 28 The File Menu...
Страница 150: ...EasyMatch QC User s Manual Version 2 1 3 38 The File Menu...
Страница 156: ...EasyMatch QC User s Manual Version 2 1 5 2 The View Menu Toolbar is not displayed...
Страница 227: ...Part III Instruments...
Страница 290: ...Part IV Reference...
Страница 325: ...EasyMatch QC User s Manual Version 2 1 Measurement Values A 35...


