


Moxi GO II
™
User Guide
Page 44
Size Gating of Scatter (Dot) Plots
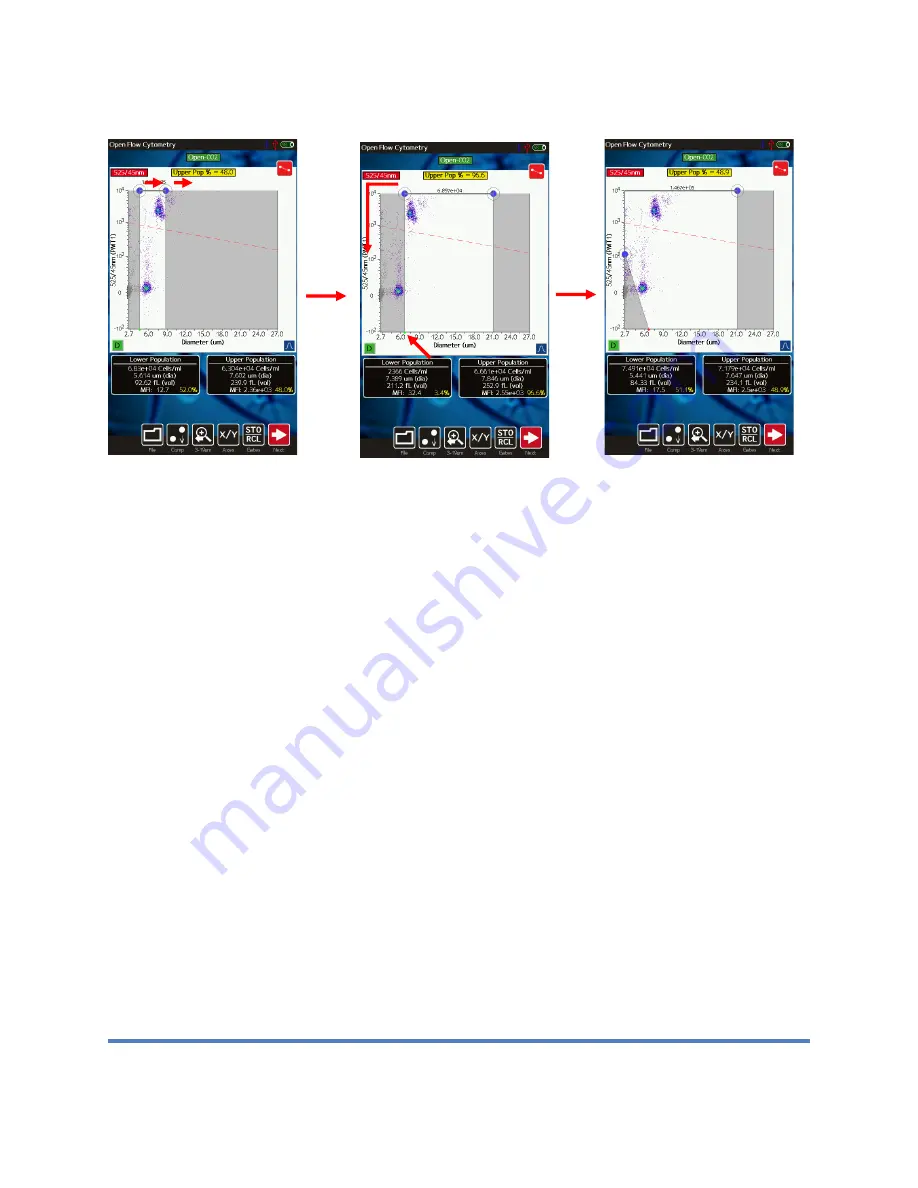
The results of all fluorescent tests (all tests except for the “Size Histogram” test) are initially
displayed as scatter plots with the size (blue) gates enabled (see image above, left). Gates can
be adjusted by touching and dragging the blue markers around the edges of the scatter plot
(above). Touching the marker at the base of the left gate toggles the marker from green
(unlocked, images above/left and above/middle) to red (locked, image above/right). Touching
the marker again will switch it back to the prior state. Moving the left cursor with base unlocked
(green) results in the base moving synchronously/equivalently with the top left cursor (gate line
is forced to be vertical). Moving the left cursor with the base marker locked (red) anchors the
base point allowing the user to pivot the top point around it (e.g. image above/right). This top
cursor can even be dragged around the left edge of the scatter plot if needed. Events to the left
of the left size gate and to the right of the right size gate are not included in the count totals or
population percentages (e.g. Live Cell %). The total particle count in the size-gated region is
displayed above the scatter plot, between the blue gating markers.
The general recommended placement is to place the left gate in the gap or “valley” between the
noise/debris counts (at the bottom left of the scatter plot) and the cell population. If there his
“valley” can be easily visualized by turning on the histogram overlays (blue button at the bottom
right of the scatter plot). The right gate is typically placed to the far right of the x-axis scale for
monodisperse (single cell type) populations. For poly-disperse populations, the right gate can
be placed in the valley between the populations (use histogram overlays to help identify precise
location).
Fluorescent Gating of Scatter (Dot) Plots
Touching the red gate toggle marker when the size (blue) markers are currently enabled
correspondingly disables the (blue) size gate markers and enables the (red) fluorescent gate
markers. The user can then touch and drag the red circles to adjust the positioning of the
Содержание MXG102
Страница 68: ...Moxi GO II User Guide Page 63...
Страница 75: ...Moxi GO II User Guide Page 70...
Страница 93: ...Moxi GO II User Guide Page 88 A subsidiary of...


