


Moxi GO II
™
User Guide
Page 21
of entering “1:1” (no dilution), “1:2” (2x dilution), “1:5” (5x dilution), and “1:10” (10x dilution).
Note: the value selected here will automatically be applied to all tests’ count outputs to
adjust the measured counts for the dilution level, providing the true (dilution adjusted)
initial starting concentration.
The value is set by touching the box (image below/right) and
touching one of the dropdown entries. The “Enter” button can then be touched to start the
test/batch. For the first test after the system is powered-up, the system will perform the laser-
homing routine (as described in the laser/cassette alignment section). For every subsequent
test/cassette side, the system will perform a spiral find and laser sweep to find align the laser
ideally to the cassette detection zone (see laser/cassette alignment section).
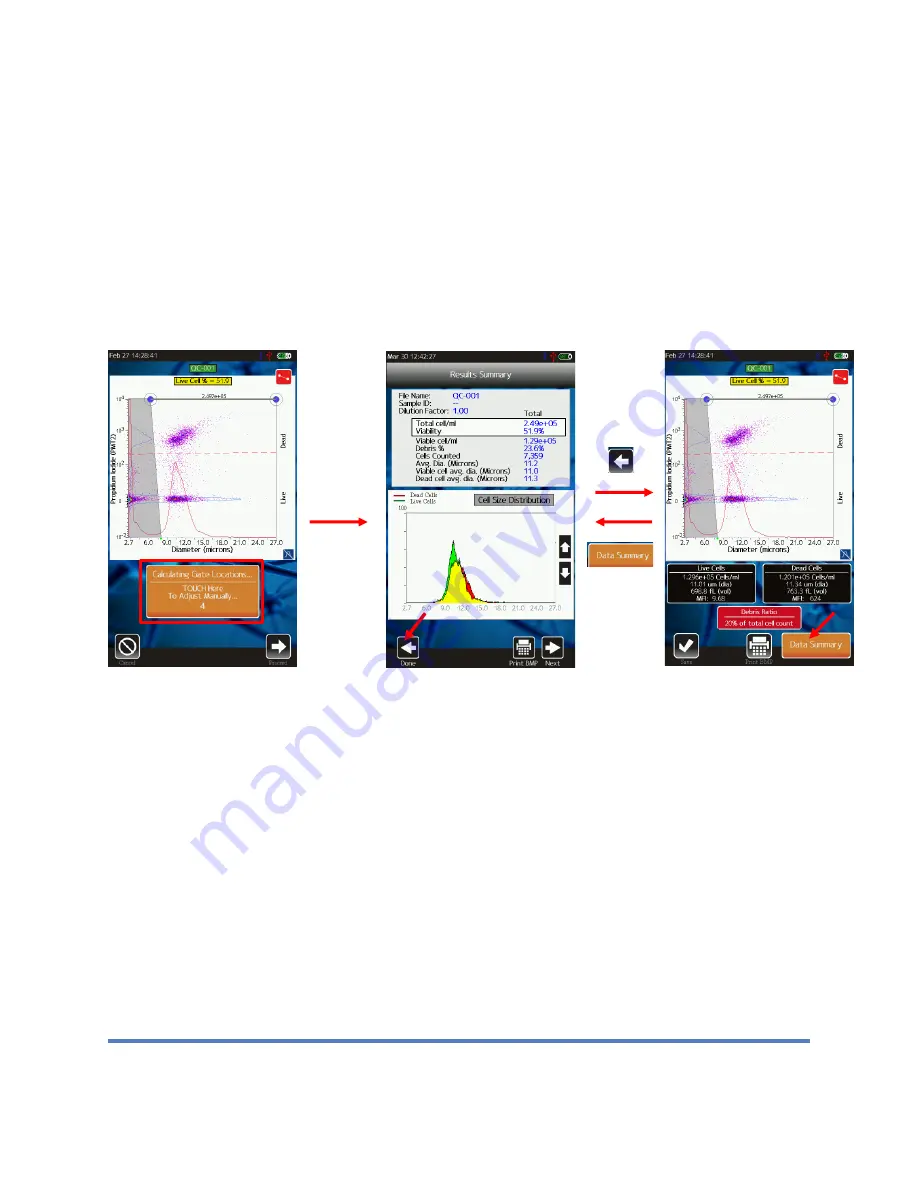
Cell QC – Initial Test Output (both Single Run and Batch)
An example of the Cell QC output is shown above. Initially (during and right after acquisition)
the user is shown the raw scatter plot data (image above/left) and given the option (by touching
the orange rectangle) to manually adjust the system’s auto-gate placement. Touching the
orange rectangle will bring the user the scatter plot gating screen (image above/right). If the
user does not touch anything, the simplified “Results Summary” screen (image above/middle) is
displayed. This initial screen is designed to provide a simple representation of all the
cell/sample data based on the system auto-gating of the PMT2 (Propidium Iodide, Viability) vs
Size scatter plot (more detail below) to identify the core cell population (by size) and determine
the viability (by PI fluorescence). The user is provided the opportunity to review the system gate
placement by touching the “Back” button. Touching that button brings up the standard PMT2
(Propidium Iodide) vs. Size scatter plot (example in image above/right). Gates can be adjusted
by touching and dragging the markers (blue/size, red/fluorescence, yellow/noise) as described
in the “PMT vs. Size Gating” section of this User Guide. It is recommended that users verify that
gate for the initial test/run with any new sample/cell types. Once verified, the user can simply
Содержание MXG102
Страница 68: ...Moxi GO II User Guide Page 63...
Страница 75: ...Moxi GO II User Guide Page 70...
Страница 93: ...Moxi GO II User Guide Page 88 A subsidiary of...


