


207
FIS Viewer
4. Click on
OK
to apply these settings.
Trend diagram
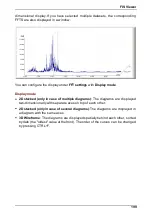
In addition to the display settings already presented with the
FFT diagram
and the
diagram information bar option the settings for the trend display and smoothing
can also be specified in the Trend diagram
dialogue window.
1. The section
Display options
allows you to adjust the background color of the
time signal diagram. You can also define here whether you wish the grid to be
displayed in the background and also its color.
2. In the
Trend display settings
you can specify field whether each characteristic
value should be displayed in a separate diagram (
Stacked view
) or whether all
characteristic values should be displayed in one diagram (
Overlapped view
).
3. You can specify which function and which period length should be used to carry
out the smoothing calculation in the
Smoothing
field.
4. In the
Information bar
field you can specify whether
diagram information
and
comments
should be displayed when a new diagram is opened.
5. In the
Toolbar
field you can specify whether
Signal selection
,
Axis settings
,
and
Zoom tools
should be displayed when you open a new diagram.
6. In the
Trend limitation on load
field you can specify how many trends of the last
days and maximum data sets should be load in the Viewer.
7. Click on
OK
to apply these settings.
Modifying the cursor options
You can modify how each individual cursor is displayed in the dialogue windows
for the various cursors.
1. Select the cursor you wish to modify from the list of cursors on the left.
2. Select the preferred cursor shape for the cursor specified above from the
Symbol
drop-down menu.
3. Select the symbol and
color
to be used for the cursor as well as the color for
vertical cursor
line
.
4. Because the differential and averaging cursors work in pairs, you can also
modify the appearance of the second cursor in this field accordingly.
5. Click on
OK
to apply these settings.
Modifying the signal settings
You can select measurement data display options in the signal dialogue
windows.
1. If fewer than 50 measuring points are displayed in the diagram window, each
measuring point can be made clearly visible as a dot. If greater than 50
206