


135
Trendline 3
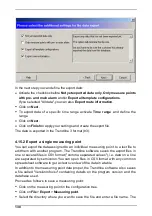
settings, choose the option
Print sensor settings
.
Print data
: Choose this option to print the measured data available for the
particular measuring point.
Print 2D graphics/Print 3D graphics: Select this option to print the
corresponding amplitude/phase graphs.
Click on
OK
to create the report. The report window opens.
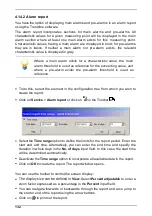
You can use the toolbar to control the screen display:
The display size can be defined in
View
. Select
Percent adjustable
to enter a
zoom factor expressed as a percentage in the
Percent
input field.
You can navigate forwards or backwards through the report and also jump to
the start or end of the report using the arrow buttons.
Click on
to print out the report.
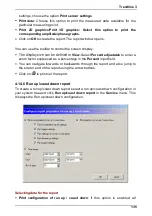
4.14.6 Run up/coast down report
To create a run up/coast down report, select a run up/coast down configuration in
your system tree and click
Run up/coast down report
in the
Service
menu. This
displays the Run up/coast down configuration.
Selecting data for the report
Print configuration of run up / coast down
: If this option is enabled, all