


206
Modifying the diagram settings
In the
Diagrams
dialog you can specify whether new diagram windows are
automatically displayed horizontally in the Viewer.
1. You can specify whether diagrams belonging to the same data set should be
identified using color in the
Diagram grouping
field.
2. If required, activate the
Tile diagrams horizontally if new diagram is displayed
checkbox.
If this option is activated the Trendline Viewer arranges the diagram windows
horizontally (below one another) and the new diagram is opened at the lowest
position in the diagram window.
If this option is deactivated, new diagram windows are cascaded.
3. Click on
OK
to apply these settings.
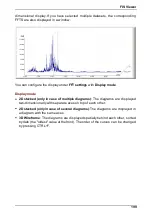
FFT diagram
You can select the various FFT diagram display options in the
FFT diagram
dialogue window.
1. You can specify the background color for the FFT diagram in the
Visual options
field. You can also define here whether you wish the grid to be displayed in the
background and also its color.
2. In the
Integration
field you can specify the measuring point in the diagram from
which the integration should be performed
3. In the
Information bar
field you can specify what information (cf. Using the
) to display when a new diagram is opened.
4. In the
Toolbar
field you can specify whether
Signal selection
,
Preview
,
Axis
settings
,
FFT settings
and
Zoom tools
should be displayed when you open a
new diagram.
5. Click on
OK
to apply these settings.
Time signal diagram
In the dialog window
Time signal diagram
, you can define certain options for
displaying a time signal diagram.
1. The section
Visual options
allows you to adjust the background color of the
time signal diagram. You can also define here whether you wish the grid to be
displayed in the background and also its color.
2. In the
Information bar
field you can specify whether
diagram information
and
comments
should be displayed when a new diagram is opened.
3. In the
Toolbar
field you can specify whether
Signal selection
,
Preview
,
Axis
settings
, and
Zoom tools
should be displayed when you open a new diagram.
188