


User Manual
33
7.5.12
Desired Resonant Amplitude
This is the target amplitude, measured in volts, for keeping the wire of the sensor
in constant excitation. The excitation voltage is adjusted automatically by the
analyzer to accommodate the target resonant amplitude. This is set to a minimum
of 100 µV and a maximum of 10 mV. Default is 2 mV.
7.5.13
Minimum- and Maximum Cut-Off Frequencies
Band-pass filters can be set to isolate a certain frequency range within which a
reading is expected to fall. See Section 7.11.1,
Frequency Range
, for more
information. Settings are frequency values.
7.5.14
Frequency-Output Format
Use this setting to select whether the output from the sensor will be given as
frequency (Hz) or frequency squared (Hz
2
). Settings are selected from lists in the
PC software. Entry in CRBasic is Boolean (0 = Hz, 1 = Hz
2
).
7.5.15
Multipliers and Offsets
Multipliers (gain, slope, or scaling) and offsets (y-intercept or shifting) allow for
linear scaling of the frequency output of each sensor. Some vibrating-wire sensors,
however, require polynomial calculations to obtain the desired engineering units.
If transformation other than linear scaling is required, the multiplier should be set
to
1
and the offset to
0
, and the transformation made through other datalogger
calculations or by post-processing of the data. Please refer to the calibration sheet
that came with each sensor to understand how the frequency output should be
transformed to obtain the desired engineering units. Appendix D,
Digits
Conversion
, and Appendix E,
Calculating Measurement Error
, contain additional
information about conversion from frequency to engineering units.
7.5.16
Steinhart-Hart Coefficients
These coefficients are used to convert thermistor resistance from ohms to
temperature in degrees Celsius. See Appendix F,
Thermistor Information
, for
more information.
7.5.17
Rainflow-Histogram Output Configurations
Output configuration settings in
DevConfig
and CRBasic are three digit values.
For example, an entry of 100 means reset histogram, divide bins by total count,
and use open form.
Options:
0 = reset histogram each output / 1 = Do not reset histogram.
0 = Divide bins by total count / 1 = use the total of each bin.
0 = Open form (includes half cycles) / 1 = Closed form (use full cycles)
Settings in
DVWTool
are selected from lists.
7.6
Sensor Selection
CDM-VW300 series analyzers work well with standard vibrating-wire sensors
that use a single-coil circuit design. In this design, two sensor leads are used to
both excite the sensor and read back the resonant frequency. When selecting a
vibrating-wire sensor, consider its frequency range and the sample rate at which
that frequency will be sampled by the datalogger or PC.
Содержание CDM-VW300 Series
Страница 2: ......
Страница 4: ......
Страница 6: ......
Страница 12: ......
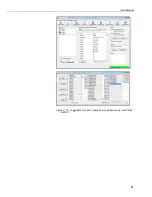
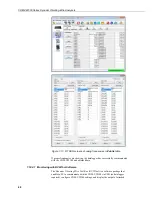
Страница 59: ...User Manual 47 Figure 7 16 LoggerNet connect screens showing frequencies from CDM VW300 ...
Страница 70: ...CDM VW300 Series Dynamic Vibrating Wire Analyzers 58 ...
Страница 76: ...Appendix B SC CPI Datalogger to CPI Interface B 4 ...
Страница 80: ...Appendix C CDM Devices and CPI Bus C 4 Figure C 2 Long cable lengths of a distributed CPI bus ...
Страница 82: ...Appendix D Digits Conversion D 2 Figure D 1 Geokon Calibration Report of a Sensor without a Thermistor ...
Страница 86: ...Appendix E Calculating Measurement Error E 4 ...
Страница 116: ...Appendix G CRBasic Program Library G 26 ...
Страница 117: ...Appendix G CRBasic Program Library G 27 ...


