G
ETTING
S
TARTED
IEC61000-3
S
OFTWARE FOR
W
INDOWS
U
SER
M
ANUAL
Page 50
VPN 98-025/7
Voltech Instruments
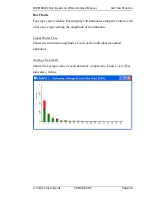
Normalized Worst Case
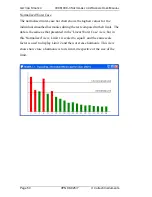
The normalised worst-case bar chart shows the highest values for the
individual smoothed harmonics during the test compared to their limit. The
data is the same as that presented in the 'Linear Worst Case' view, but in
this 'Normalized' view, Limit 1 is scaled to equal 1 and the same scale
factor is used to display Limit 2 and the worst case harmonic. This view
shows how close a harmonic is to its limit, irrespective of the size of the
limit.
Summary of Contents for PM3000ACE
Page 4: ......


