IEC61000-3 S
OFTWARE FOR
W
INDOWS
U
SER
M
ANUAL
G
ETTING
S
TARTED
Voltech Instruments
VPN 98-025/7
Page 49
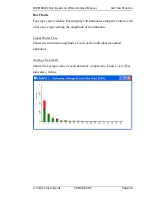
Bar Charts
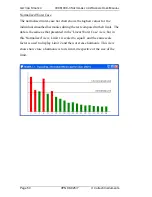
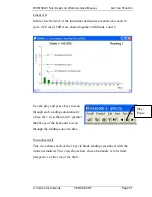
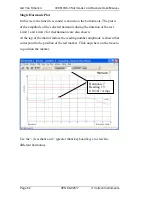
Four types are available. Each displays 40 harmonics along the bottom with
a bar above representing the amplitude of the harmonic.
Linear Worst Case
Shows the maximum amplitude of each of the individual smoothed
harmonics.
Average Vs Limit 1
Shows the average value of each harmonic compared to Limit 1. A red bar
indicates a failure.
Summary of Contents for PM3000ACE
Page 4: ......


