1. OPERATION
1-59
1.35.4
Cursor position
The cursor position (range and bearing of
cursor from the own ship) is shown at the
top right corner on the screen.
The bearing reference is changed simulta-
neously with the EBL1 reference. To
change the cursor position's bearing refer-
ence, click EBL1's bearing reference icon. See section 1.19 for details.
1.35.5
ROT, Rudder and Autopilots Graphs
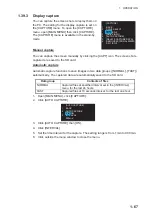
The ROT (Rate of Turn), RUDDER and AUTOPILOT graphs appear at the top of the
screen.
ROT graph
The ROT graph displays ship’s rate of turn (degrees/min), using the ROT signal fed
from an ROT sensor. There is no NMEA signal and also no indication.
To set the ROT graph scale:
1. Open [MAIN MENU] then click [NAV DATA].
2. Click [ROT SCALE].
3. Click the desired scale among 30 degees, 90 degrees and 300 degrees.
Rudder graph
The rudder graph shows the rudder angle. There is no NMEA signal and also no indi-
cation.
To set the rudder graph scale:
1. Open [MAIN MENU] then click [NAV DATA].
2. Click [RUDDER SCALE].
3. Click the desired scale among 30 degrees, 90 degrees, 120 degrees and 180 de-
grees.
Autopilot graph
1)
Follow-up (FU) mode
When the autopilot is in the follow-up mode, the follow-up rudder command is in-
dicated on the RUDDER scale. In addition, "
V
FOLLOW UP" is indicated at the top
of the screen. In follow-up mode, the autopilot controls the rudder so that actual
rudder angle becomes same as commanded one.
2)
Autopilot (AP) mode
When the autopilot is in the "autopilot" mode and a ROT signal is available from
the autopilot, the autopilot graph shows ROT command. The actual ROT com-
mand set on the autopilot is represented by a small circle on the ROT scale. In ad-
CAPT
±300º/min
±180º
OS POSN N
CURSOR TTG
18m20s
2. 4m/s
0° 00. 219°
WIND
E
0° 00. 397°
►
6.34NM / 300.3°R
ROT
RUDDER
±300 º/min
±180 º
RUDDER graph
Autopilot graph
ROT graph


