Using the QC Programs
8-10
8.2.3 Reviewing QC Results
You can review the saved results in either of the two modes – “
L-J Graph
” and “
QC
Table
”.
L-J Graph
At the “
Controls
” screen, press [F4] to enter the”
L-J Graph
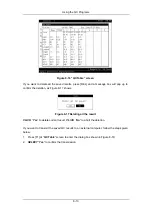
” screen, as Figure 8-13, Figure
8-14 and Figure 8-15 shows.
Figure 8-13 L-J graph screen (1)
Figure 8-14 L-J graph screen (2)
Summary of Contents for BC-2800
Page 1: ...BC 2800 Auto Hematology Analyzer Operator s Manual ...
Page 2: ......
Page 12: ......
Page 24: ...Using This Manual 1 12 Figure 1 4 High voltage warning label 7 High Voltage 7 ...
Page 62: ......
Page 91: ...Customizing the Analyzer Software 5 29 Figure 5 46 Saving changes ...
Page 92: ......
Page 170: ...Using the QC Programs 8 14 Figure 8 18 Transmission dialog box ...
Page 196: ......
Page 248: ......
Page 252: ......
Page 266: ......
Page 284: ...Appendices E 10 Hemoglobin Concentration ...
Page 286: ...P N 2800 20 28795 2 0 ...


