Understanding the System Principles
3-5
3.4.2 Measurement Principles
WBC
measurement
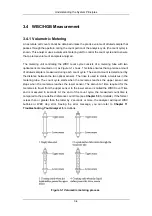
WBCs are counted and sized by the impedance method, as Figure 3-2 shows. This method is
based on the measurement of changes in electrical resistance produced by a particle, which
in this case is a blood cell, suspended in a conductive diluent as it passes through an
aperture of known dimensions. An electrode is submerged in the liquid on both sides of the
aperture to create an electrical pathway. As each particle passes through the aperture, a
transitory change in the resistance between the electrodes is produced. This change
produces a measurable electrical pulse. The number of pulses generated indicates the
number of particles that passed through the aperture. The amplitude of each pulse is
proportional to the volume of each particle. Each pulse is amplified and compared to the
internal reference voltage channels, which only accepts the pulses of certain amplitude. If the
pulse generated is above the WBC threshold, it is counted as a WBC.
Figure 3-2 Impedance method of counting and sizing
HGB
measurement
HGB is determined by the colorimetric method. The WBC/HGB dilution is delivered to the
bath where it is bubble mixed with a certain amount of lyse, which converts hemoglobin to a
hemoglobin complex that is measurable at 525 nm. An LED is mounted on one side of the
bath and emits a beam of monochromatic light, whose central wavelength is 525nm, and then
is measured by a photo-sensor that is mounted on the opposite side. The signal is then
amplified and the voltage is measured and compared to the blank reference reading
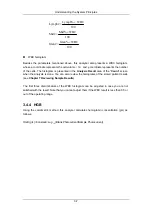
(readings taken when there is only diluent in the bath). The HGB is calculated per the
following equation and expressed in g/L.
Summary of Contents for BC-2800
Page 1: ...BC 2800 Auto Hematology Analyzer Operator s Manual ...
Page 2: ......
Page 12: ......
Page 24: ...Using This Manual 1 12 Figure 1 4 High voltage warning label 7 High Voltage 7 ...
Page 62: ......
Page 91: ...Customizing the Analyzer Software 5 29 Figure 5 46 Saving changes ...
Page 92: ......
Page 170: ...Using the QC Programs 8 14 Figure 8 18 Transmission dialog box ...
Page 196: ......
Page 248: ......
Page 252: ......
Page 266: ......
Page 284: ...Appendices E 10 Hemoglobin Concentration ...
Page 286: ...P N 2800 20 28795 2 0 ...

