86
Installation Manual
User Guide / Timeline
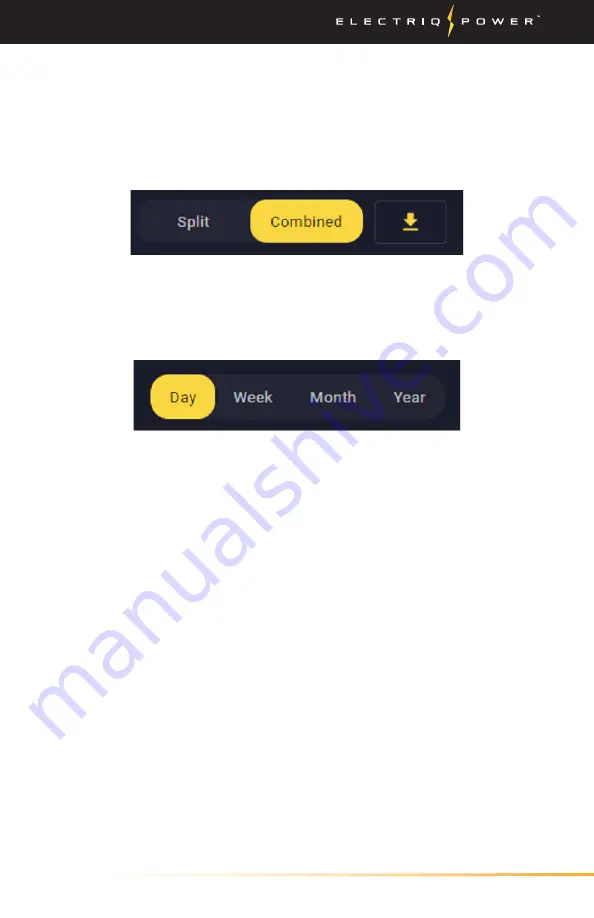
Choosing the “Split” tab separates the energy activity.
Choosing the combined chart combine all the energy activity on one
chart.
Choosing the down arrow exports either 15 minute or one hour the
energy data to a csv file.
Day, Week, Month and Year give daily, weekly, monthly, and yearly
views of your history using PowerPod 2. These views are helpful for
understanding your home’s general energy behaviors over longer
periods of time.


