191
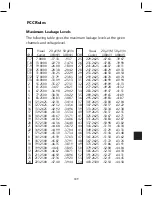
Visual
20 µV/m 50 µV/m
Visual
20 µV/M 50 µV/m
CH.
Carrier
(dBmV) (dBmV) CH.
Carrier
(dBmV) (dBmV)
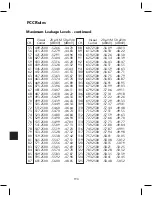
126 805.2500 -58.54
-50.58
143 907.2500 -59.58
-51.62
127 811.2500 -58.61
-50.65
144 913.2500 -59.64
-51.68
128 817.2500 -58.67
-50.71
145 919.2500 -51.73
-51.73
129 823.2500 -58.73
-50.78
146 925.2500 -59.75
-51.79
130 829.2500 -58.80
-50.84
147 931.2500 -59.81
-51.85
131 835.2500 -58.86
-50.90
148 937.2500 -59.86
-51.90
132 841.2500 -58.92
-50.96
149 943.2500 -59.92
-51.96
133 847.2500 -58.98
-51.03
150 949.2500 -59.97
-52.01
134 853.2500 -59.05
-51.09
151 955.2500 -60.03
-52.07
135 859.2500 -59.11
-51.15
152 961.2500 -60.08
-52.12
136 865.2500 -59.17
-51.21
153 967.2500 -60.13
-52.18
137 871.2500 -59.23
-51.27
154 973.2500 -60.19
-52.23
138 877.2500 -59.29
-51.33
155 979.2500 -60.24
-52.28
139 883.2500 -59.35
-51.39
156 985.2500 -60.29
-52.34
140 889.2500 -59.40
-51.45
157 991.2500 -60.35
-52.39
141 895.2500 -59.46
-51.50
158 997.2500 -60.40
-52.44
142 901.2500 -59.52
-51.56
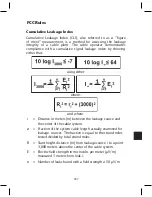
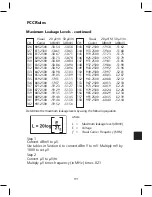
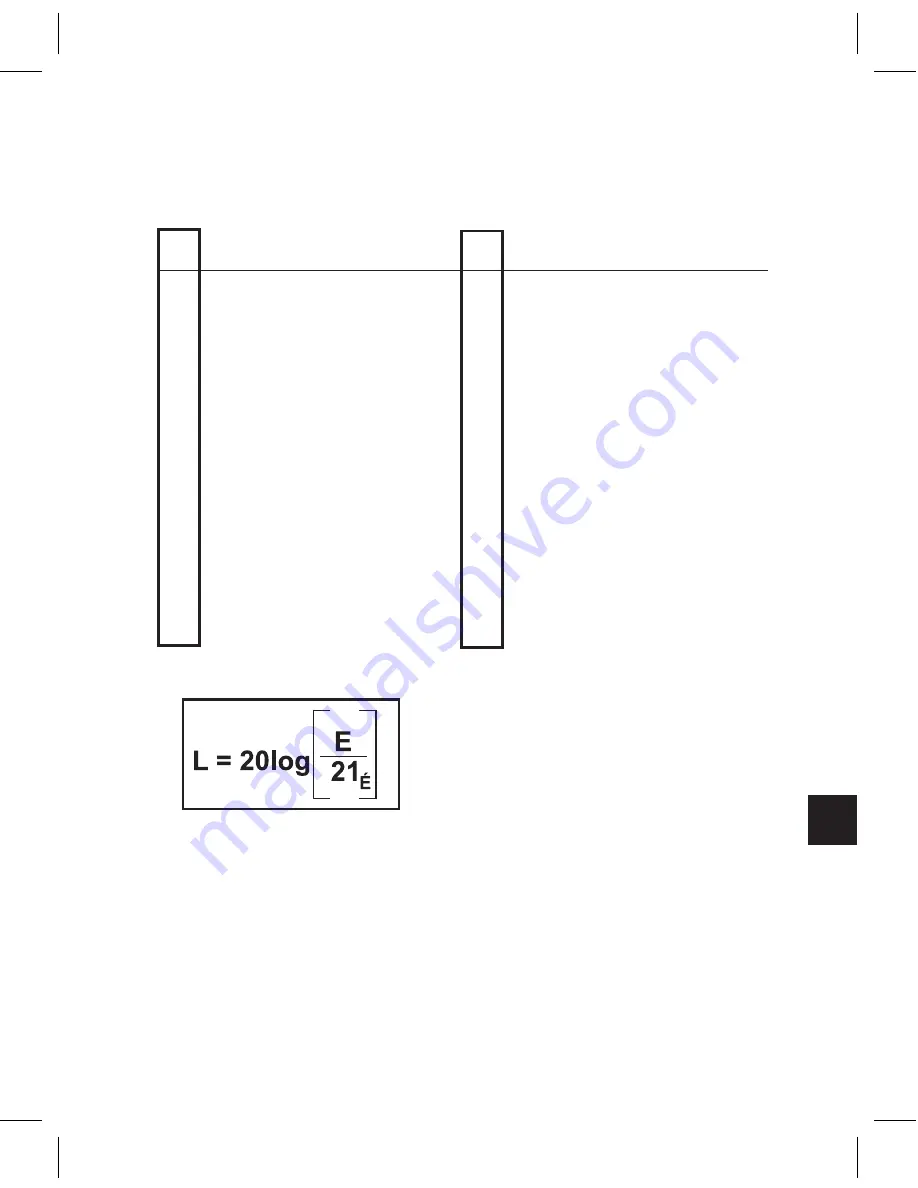
Determine the maximum leakage levels by using the following equation:
where:
L = Maximum leakage level (dBmV)
E = Voltage
ƒ = Visual Carrier Frequency (MHz)
Step 1
Convert dBmV to µV.
Use tables in Section 6 to convert dBmV to mV. Multiply mV by
1000 to set µV.
Step 2
Convert µV to µV/m.
Multiply µV times frequency (in MHz) times .021
FCC Rules
Maximum Leakage Levels - continued
Summary of Contents for AMM-806
Page 86: ...79 TVCB PC Installation ...
Page 93: ...86 SMI Installation Torque Patterns 1 Start Here 2 3 4 5 6 1 Start Here 2 3 4 4 PORT 8 PORT ...
Page 125: ...118 Fiber Optics Fiber Loss vs Path Length Single Mode 1550 nm ...
Page 156: ...149 Cable TV Channel Format NTSC NTSC Composite Video Waveform ...
Page 157: ...150 US Frequency Spectrum ...
Page 158: ...151 FCC Aeronautical Band Frequencies Used for Communication and Navigation ...
Page 175: ...168 Common CATV Symbols ...
Page 176: ...169 Common CATV Symbols ...
Page 177: ...170 Digital L Band Distribution Symbols ...
Page 178: ...171 Digital L Band Distribution Symbols ...
Page 183: ...176 Typical Cable Attenuation Chart in dB 100 Feet 68 F 20 C ...
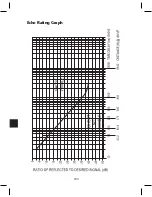
Page 187: ...180 Echo Rating Graph ...
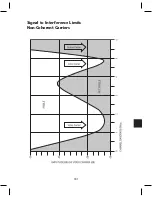
Page 188: ...181 Signal to Interference Limits Non Coherent Carriers ...
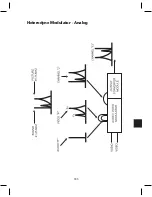
Page 190: ...183 Heterodyne Modulator Analog ...
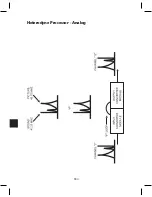
Page 191: ...184 Heterodyne Processor Analog ...
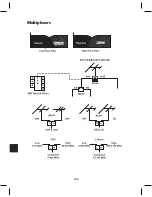
Page 213: ...206 Multiplexers ...
Page 285: ...Rev 8 0 ...

