6100-Gfast Multifunction Copper Tester Operation Manual
© 2020 Radiodetection Ltd
125
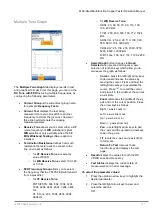
Range
allows you to set the range from the
given list.
Gain
allows you to select a gain test parameter
from the given list.
Variable Gain
(
Auto TDR
only), when
enabled, automatically increases the amplitude
gain as distance increases on the graph. In this
way, you do not have to tweak the gain just to
see events at the far end.
Select from 4 possible entries:
o
Disabled
o
Enabled
o
Disabled with Auto Scale
o
Enabled with Auto Scale
Use
Auto Scale
to easily capture and
see the detected
Largest Event
applying automatic scaling of the
amplitude of the trace in the vertical
axis.
Pulse Width
is a non-editable value in
Auto
TDR
but can be selected from a given list in
Manual
and
xTalk TDR
.
Dual Trace Offset %
is a configurable offset
parameter for the secondary trace, with a
range of -100 % to +100 %.
Note: If the loaded secondary trace offset = 0, then the
primary and secondary traces will overlap.
VOP
allows you to change the velocity of
propagation value for the cable.
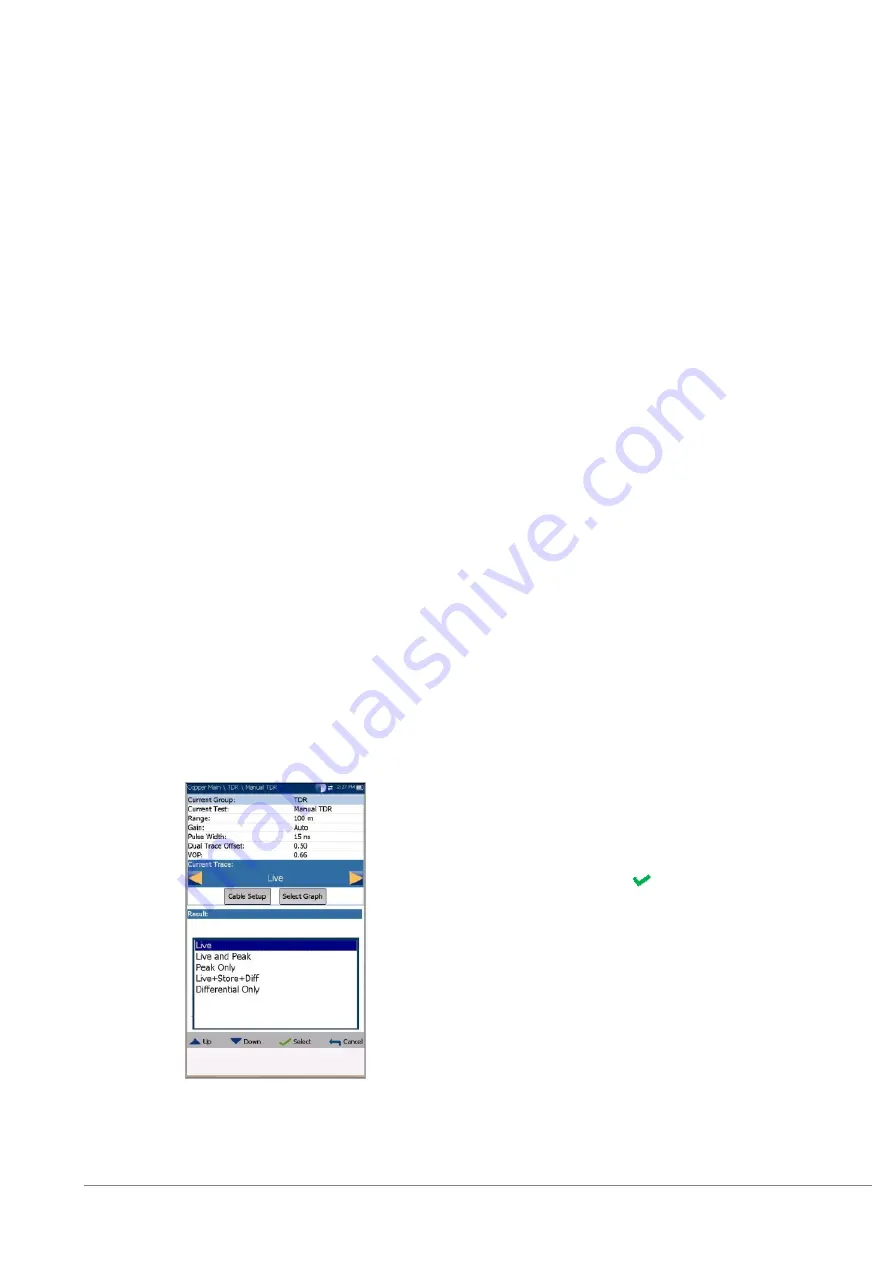
Current Trace
(available only in
Manual TDR
)
allows you to turn on/off
Live
and
Peak
traces
and calculates the
Differential
trace. Select
one of the following:
o
Live
turns Peak Hold off clearing
previously collected
minimum/maximum measurement
values. This is the default.
o
Live and Peak
turns Peak Hold on and
collects minimum/maximum
measurement values, displaying all 3
traces.
o
Peak Only
turns Peak Hold on
displaying only Peak traces with no
offset.
o
Live+Store+Diff
selection is only
available while the test is running and a
Trace is loaded. The differential trace
is calculated between Live and loaded
stored traces during the measurement,
and displayed on the graph with no
offset.
o
Differential Only
selection is only
available while the test is running and a
Trace is loaded. Only the calculated
differential is displayed on the graph.
Cable Setup
button opens a new page that
allows you to set the
Cable Parameters
for the
Current Test
.
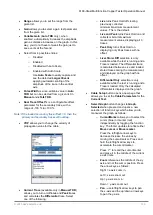
Select Graph
button changes to
Graph
Selected
when pressed and opens a new
selection of function keys which allow you to
maneuver the graph as follows:
o
Cursor/Marker
allows you to select the
cursor (blue) or marker (red)
independently by toggling the function
key. The footer updates to reflect either
Move cursor
or
Move marker
.
Press the left/right arrow keys to
decrease/increase the values by
moving the cursor/marker. Press and
hold the left/right arrow keys to
accelerate the cursor/marker.
Press to recall the cursor/marker
and place it in the middle of the current
x-axis limits.
o
Zoom
references the middle of the x/y
axis and not the cursor position. Press
the arrow keys as follows:
Right = x-axis zoom in.
Left = x-axis zoom out.
Up = y-axis zoom in.
Down = y-axis zoom out.
o
Pan
- use left/right arrow keys to pan
the x-axis and the up/down arrow keys
to pan the y-axis.


