5. To display how the clients are distributed over the radios, click the Radio button in
the Client Distribution pane.
The page adjusts and shows the types of clients for each radio.
6. To display recent clients for all networks or a single network, in the Connected Clients
pane, click the icon in the menu under Recent Clients, and select All WiFi Clients
or the clients for a specific WiFi network (SSID).
For your selection, the pane displays the total number of connected clients and the
device names of the connected clients.
7. To display information about a connected client, click its device name.
The page displays the MAC address, device name, IP address, and SSID for the
client. You can also view more information, including very detailed information (see
Step 11 and Step 12).
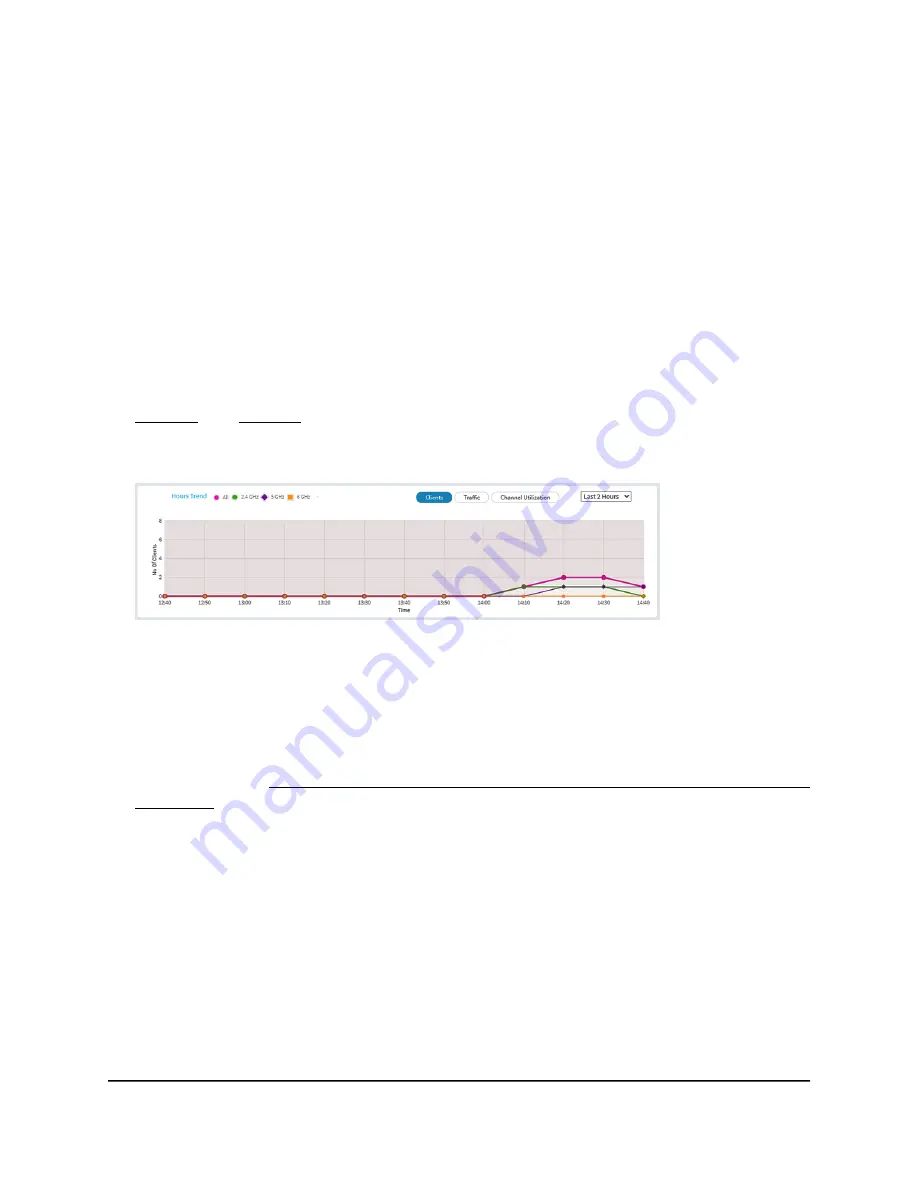
8. To display trends about clients, scroll down to the Hours Trend pane.
The Hours Trend pane shows a graph with the number of clients, the traffic in MBps,
or the channel utilization over a period that you can select. (The previous figure
shows the trend for the last 2 hours.) By default, the client information is selected
(that is, the Client button is selected) and the graph shows the total number of clients
for all radios and the number of clients for each radio (2.4 GHz, 5 GHz, and 6 GHz).
You can also click the Traffic button or the Channel Utilization button. For more
information, see View WiFi and Ethernet traffic, traffic and ARP statistics, and channel
utilization on page 193.
9. To display more information, point to a node on one of the lines on the graph.
10. To change the period over which information is filtered and displayed, select the
number of recent hours from the menu to the right of the buttons.
User Manual
190
Monitor the Access Point and the
Network
Insight Managed WiFi 6E AXE7800 Tri-band Multi-Gig Access Point Model WAX630E


