


Chapter 3 Working with MultiLab
97
Use the cursors (see page 58) to select the graph and data range to which you want
to apply the Timing Wizard.
•
Time
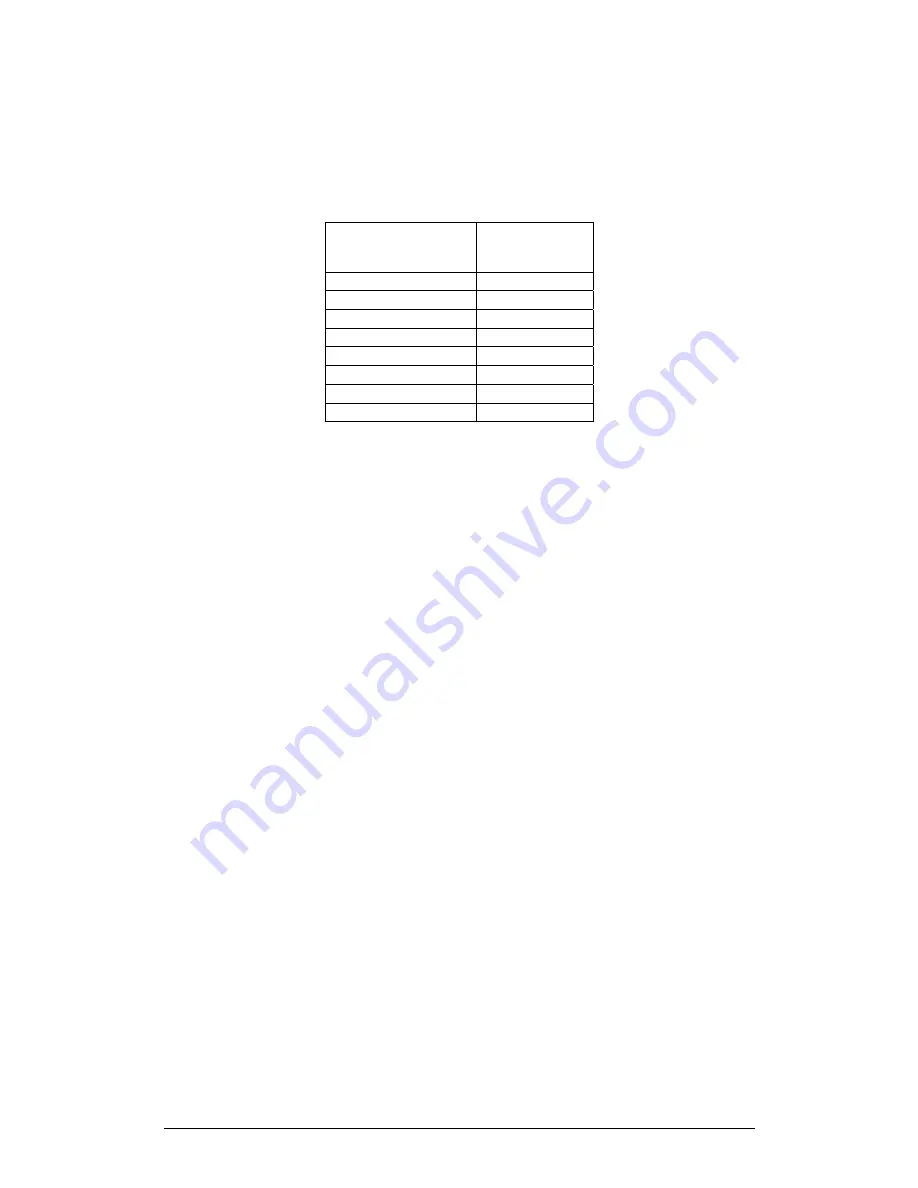
resolution
The time resolution depends on the sampling rate. Use the table below to select a
rate that meats your needs.
Rate
(samples per
second)
Resolution
10 0.1s
25 0.04s
50 0.02s
100 0.01s
500 2ms
1000 1ms
2000 0.5ms
20800 0.05ms
•
Use the Trigger
For fast events and high sampling rates use the Trigger tool (see page 69) to initiate
the data logging.
3.8.3. Crop
Tool
The Crop tool enables you to trim the edges of a data set. Use it to remove unwanted
data or to apply manual curve fitting to a desired range of data points.
The time scale of the trimmed data is shifted so that it will start at
0
=
t
.
If you want the automatic curve fit equation to start at
0
=
t
, apply the crop tool
before any type of curve fitting
After applying the crop tool, the trimmed data set replaces the original set on the
graph display and a new icon is added to the Data Map under cropped data.
1. To trim all data up to a point
1. Position a cursor (see page 58) on the data point
2. Click on the
Graph
menu, then click
Crop
.
2. To trim all data outside a selected range
1. Use the cursors to select the range you want to keep
2. Click on the
Graph
menu, then click
Crop
.
3.8.4. Capture
Tool
The Capture tool enables you to capture and record specific data points from the
TriLog stream of data, like taking snapshots of the dynamic process. For example,
you can design a light refraction experiment that will record the angle of the refracted


